3.3 Basic waveform shapes

import matplotlib
if not hasattr(matplotlib.RcParams, "_get"):
    matplotlib.RcParams._get = dict.get

3.3 Basic waveform shapes#

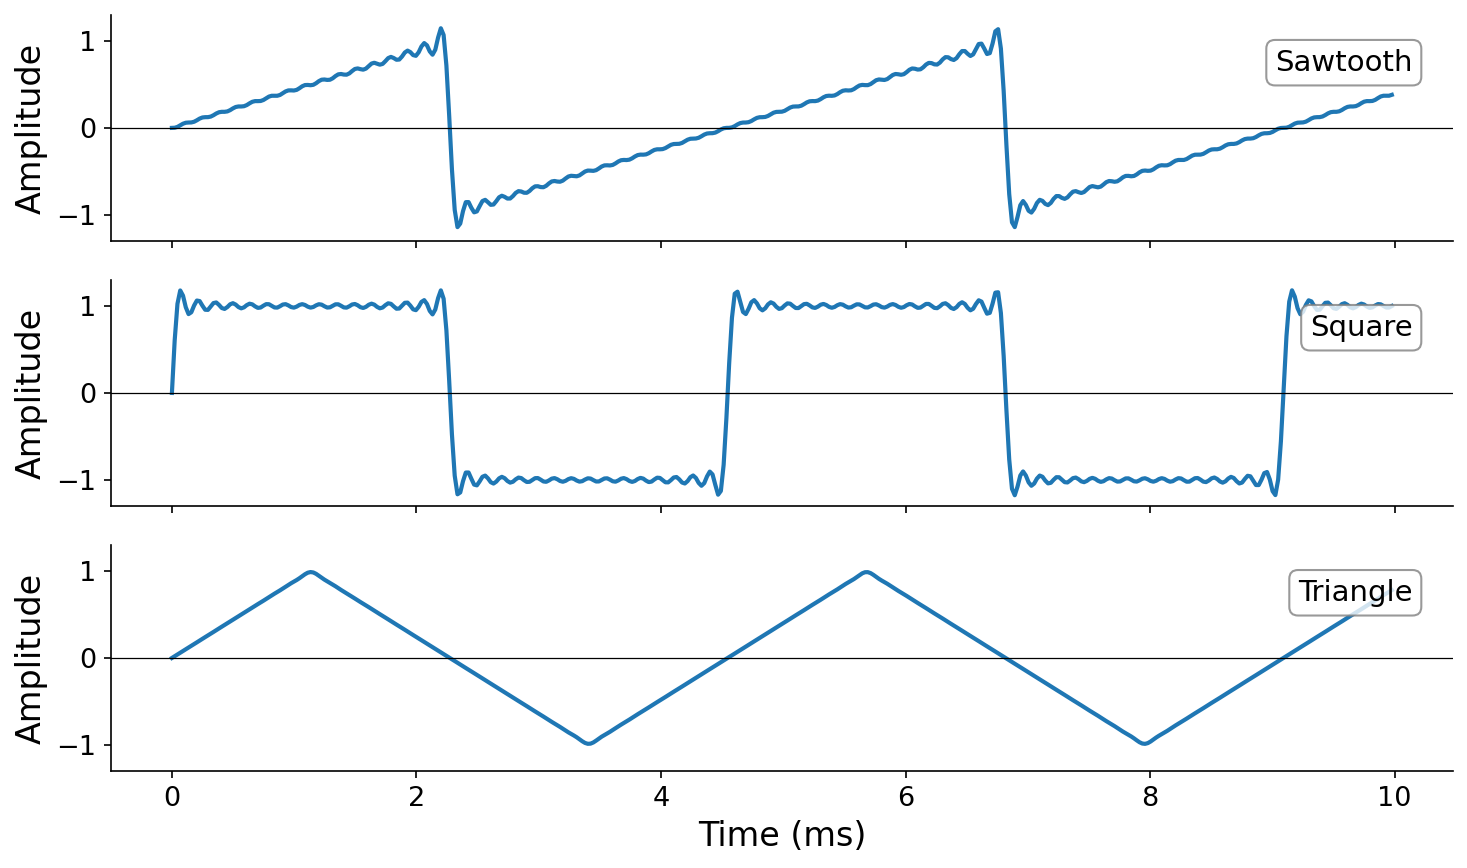
If you’ve played with synthesizers before, you may have encountered periodic waveform shapes besides sine waves: sawtooth, square, and triangle waves. These are ubiquitous in synthesis, and each has a distinctive sonic character.

Because these are all periodic, the Fourier series guarantees that they live within the parameter space of additive synthesis — each is defined by a particular pattern of harmonic amplitudes. The key idea for each waveform is how the harmonic amplitudes scale with harmonic number \(k\):

Sawtooth wave. A bright, buzzy tone. All harmonics are present, and the amplitudes fall off as \(1/k\). This slow decay means upper harmonics remain strong, giving the sawtooth its characteristic brightness.

Square wave. A hollow, clarinet-like tone. Only odd harmonics are present (\(k = 1, 3, 5, \ldots\)), and the amplitudes also fall off as \(1/k\). The missing even harmonics give the square wave its hollow character.

Triangle wave. A softer, more muted tone. Like the square, only odd harmonics are present, but the amplitudes decrease much faster — as \(1/k^2\). This rapid decay makes the triangle the smoothest of the three.

Note

The exact Fourier coefficients include constant factors and signs that affect scaling and orientation. For the sawtooth: \(a_k = 2(-1)^{k+1} / (\pi k)\). For the square: \(a_k = 4/(\pi k)\) for odd \(k\), \(0\) for even. For the triangle: \(a_k = 8(-1)^{(k-1)/2}/(\pi^2 k^2)\) for odd \(k\), \(0\) for even. The proportional relationships (\(1/k\) vs. \(1/k^2\), all harmonics vs. odd only) are more important to learn than these specifics.
Sawtooth wave

Square wave

Triangle wave

Sawtooth, square, and triangle waveforms synthesized via additive synthesis with K = 32 harmonics

Sawtooth, square, and triangle waves at 220 Hz, built from \(K = 32\) harmonics. The waveform shapes emerge from the particular amplitude patterns of their harmonics.

Notice the sonic differences: the sawtooth is the brightest (strongest upper harmonics), the square has a distinctive hollow quality (missing even harmonics), and the triangle is the smoothest (harmonics die off quickly). These perceptual differences arise entirely from the amplitude coefficients.

The full code is in code/waveforms.py.

The interactive below builds all three shapes from their recipes. Pick a waveform, then drag \(K\) and watch the sum approach the ideal shape.

# hide
# no-output
from IPython.utils.capture import capture_output
with capture_output():
    %pip install -q plotly anywidget

import asyncio
import os
import numpy as np
import plotly.graph_objects as go
from plotly.subplots import make_subplots
import ipywidgets as widgets
from IPython.display import Audio
import icm_plotly
from icm_plotly import RED, GOLD, STEEL

Pick a waveform and drag \(K\): each step adds the next harmonic of the recipe to the running sum, bending it toward the ideal shape. For the square and triangle waves, the even harmonics add nothing. The audio card underneath always plays the current sum.

# hide
# autorun
f0 = 220.0                            # fundamental (A3)
n_max = 16
T = 2 / f0                            # two cycles on screen
t = np.linspace(0.0, T, 900, endpoint=False)
k = np.arange(1, n_max + 1)
odd = k % 2 == 1
sr = 44100
seg = np.arange(sr) / sr              # one second, for the ear

# the exact Fourier coefficients of the three classic shapes
COEFS = {
    "Sawtooth": 2 * (-1.0) ** (k + 1) / (np.pi * k),
    "Square": np.where(odd, 4 / (np.pi * k), 0.0),
    "Triangle": np.where(odd, 8 * (-1.0) ** ((k - 1) // 2) / (np.pi * k) ** 2, 0.0),
}
IDEALS = {
    "Sawtooth": 2 * ((f0 * t + 0.5) % 1.0) - 1,
    "Square": np.sign(np.sin(2 * np.pi * f0 * t)),
    "Triangle": (2 / np.pi) * np.arcsin(np.sin(2 * np.pi * f0 * t)),
}
# row n-1 of SUMS[w] is the wave after harmonics 1..n
PARTIALS = {w: a[:, None] * np.sin(2 * np.pi * f0 * k[:, None] * t[None, :])
            for w, a in COEFS.items()}
SUMS = {w: np.cumsum(p, axis=0) for w, p in PARTIALS.items()}
MAGS = {w: np.abs(a) for w, a in COEFS.items()}

def figure():
    fig = make_subplots(rows=1, cols=2, column_widths=[0.62, 0.38],
                        horizontal_spacing=0.12)

    # left: the ideal shape as a fixed reference, the sum drawn on top
    fig.add_scatter(x=t * 1000, y=IDEALS["Sawtooth"], mode="lines",
                    line=dict(color=STEEL, width=1.6), row=1, col=1)
    fig.add_scatter(x=t * 1000, y=SUMS["Sawtooth"][0], mode="lines",
                    line=dict(color=RED, width=2), row=1, col=1)
    fig.add_scatter(x=t * 1000, y=PARTIALS["Sawtooth"][0], mode="lines",
                    line=dict(color=GOLD, width=1.4), row=1, col=1)
    fig.update_xaxes(title_text="Time (ms)", fixedrange=True, row=1, col=1)
    fig.update_yaxes(range=[-1.5, 1.5], title_text="Amplitude",
                     fixedrange=True, row=1, col=1)

    # right: the recipe; joined bars light up
    fig.add_bar(x=k, y=MAGS["Sawtooth"],
                marker_color=[GOLD] + [STEEL] * (n_max - 1), row=1, col=2)
    fig.update_xaxes(title_text="Harmonic k", fixedrange=True, row=1, col=2)
    fig.update_yaxes(range=[0, 1.35], title_text="Amplitude |aₖ|",
                     fixedrange=True, row=1, col=2)
    return fig

def controls(fig):
    wave = widgets.Dropdown(description="Waveform",
                            options=["Sawtooth", "Square", "Triangle"])
    n = widgets.IntSlider(description="Harmonics K", min=1, max=n_max, value=1)

    # the defaults snapshot the arrays; the page's notebooks share one kernel
    def update(w, n, SUMS=SUMS, PARTIALS=PARTIALS, MAGS=MAGS, IDEALS=IDEALS,
               n_max=n_max):
        with fig.batch_update():
            fig.data[0].y = IDEALS[w]
            fig.data[1].y = SUMS[w][n - 1]
            fig.data[2].y = PARTIALS[w][n - 1]
            fig.data[3].y = MAGS[w]
            # joined harmonics in red, the newest in gold, the rest waiting
            fig.data[3].marker.color = (
                [RED] * (n - 1) + [GOLD] + [STEEL] * (n_max - n))

    widgets.interactive_output(update, {"w": wave, "n": n})

    # the audio card under the controls: the previous clip stays in place
    # while you drag (so the layout never jumps) and is swapped for the new
    # one when the pointer releases (keyboard nudges settle on a timer). It is
    # written through the Output's synced `outputs` trait, which works
    # outside a kernel message, where display() output has no destination
    out = widgets.Output()
    gate = icm_plotly.release_gate()   # pointer state: is a slider mid-drag?
    pending = []
    dirty = []

    def render(COEFS=COEFS, k=k, seg=seg, f0=f0, sr=sr):
        a = COEFS[wave.value][:n.value, None]
        x = (a * np.sin(2 * np.pi * f0 * k[:n.value, None] * seg)).sum(axis=0)
        x *= 0.125 / np.abs(x).max()          # about -18 dBFS, a safe level
        x[:441] *= np.linspace(0, 1, 441)
        x[-441:] *= np.linspace(1, 0, 441)
        audio = Audio(x.astype(np.float32), rate=sr, normalize=False)
        data, metadata = get_ipython().display_formatter.format(audio)
        # one assignment swaps the old card for the new one in place, so
        # the page never shows an empty card and nothing shifts
        out.outputs = ({"output_type": "display_data",
                        "data": data, "metadata": metadata},)

    async def settle():
        await asyncio.sleep(0.25)
        pending.clear()
        if dirty and not gate.dragging:
            dirty.clear()
            render()

    def on_change(_):
        dirty.append(True)
        if pending:
            pending.pop().cancel()
        pending.append(asyncio.ensure_future(settle()))

    def on_release(change):
        if not change["new"] and dirty:
            if pending:
                pending.pop().cancel()
            dirty.clear()
            render()

    gate.observe(on_release, names="dragging")

    wave.observe(on_change, names="value")
    n.observe(on_change, names="value")
    if not os.environ.get("ICM_BOOK_BUILD"):   # the build bakes no card
        render()
    return widgets.VBox([wave, n, out, gate])

icm_plotly.show(figure, controls)
WaveformSawtooth
Harmonics K1