|
|
Turbulence near hot surfaces such as desert terrains and roads during the summer,
causes shimmering, distortion and blurring in images. While recent works have focused on image
restoration, this paper explores what information about the scene can be extracted from the
distortion caused by turbulence. Based on the physical model of wave propagation, we first study
the relationship between the scene depth and the amount of distortion caused by homogenous
turbulence. We then extend this relationship to more practical scenarios such as finite extent and
height-varying turbulence, and present simple algorithms to estimate depth ordering, depth
discontinuity and relative depth, from a sequence of short exposure images. In the case of general
non-homogenous turbulence, we show that a statistical property of turbulence can be used to improve
long-range structure-from-motion (or stereo). We demonstrate the accuracy of our methods in both
laboratory and outdoor settings and conclude that turbulence (when present) can be a strong and useful
depth cue.
|
Publications
"Depth from Optical Turbulence"
Yuandong Tian, Srinivasa G. Narasimhan and Alan J. Vannevel
Proc. of Computer Vision and Pattern Recognition (CVPR),
Jun, 2012.
[PDF]
[Supp]
[Poster]
|
Code and Data
Will be published soon.
|
Illustration
|
|
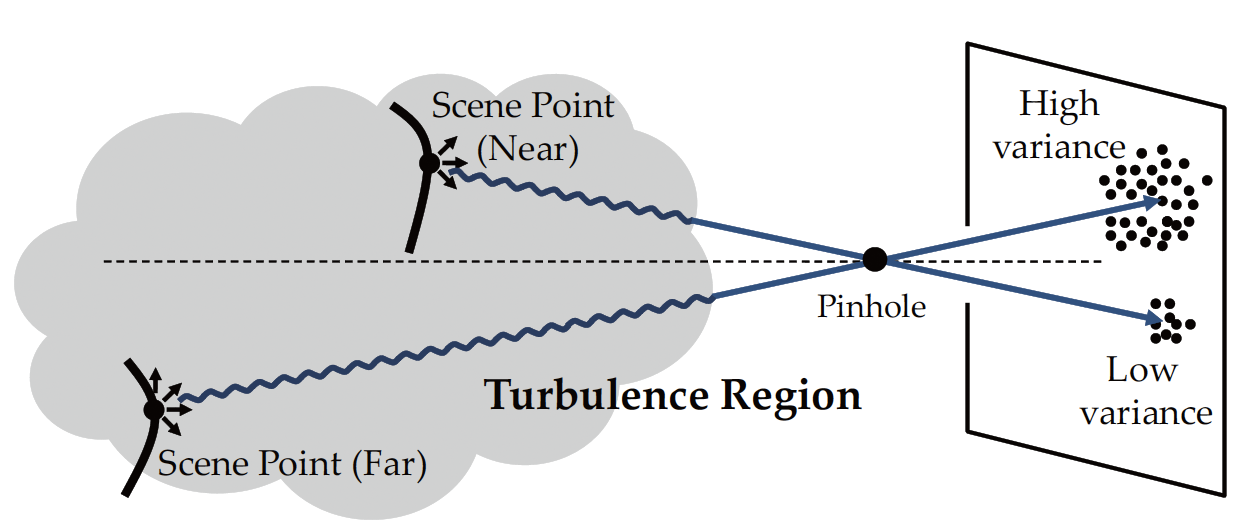
Principle for Depth from Optical Turbulence
Random fluctuations in the refractive index of a medium cause the perturbation of
a light wave radiating from a scene point. The resulting image projections of the scene point
over time are also random. The longer the distance of a scene point from the camera, the
greater the variance of its image projection.
|
|

|
Phase difference of incident light causes fluctuation of image projection
The phase difference of an incident wave (e.g., the phase
of point B leads that of A) at the aperture determines the
angle-of-arrival &alpha (AoA) and in turn, the center of the diffraction
kernel, i.e., the location of the projected scene point in the image plane.
|
|

|
Image formation through turbulence.
(a): Both the camera and the scene are immersed within a homogeneous turbulence region. (b): The camera and/or
scene are outside the turbulence region.
|
|

|
Experimental setup:
Three adjacent electric cooking griddles are heated up to
400 degrees Fahrenheit to create hot air turbulence. A camera observes a scene
through the turbulence. By varying the temperature, we can emulate a variety of outdoor
turbulence strengths and path-lengths of several kilometers.
|
|
Results

|
LED experiments in the turbulence region
Left: LEDs are immersed in the turbulence region.
Right: The relationship between the variance of LED projections and their groundtruth depths
is very close to linear (with correlation coefficient being 0.987), and is consistent with
our model.
|
|
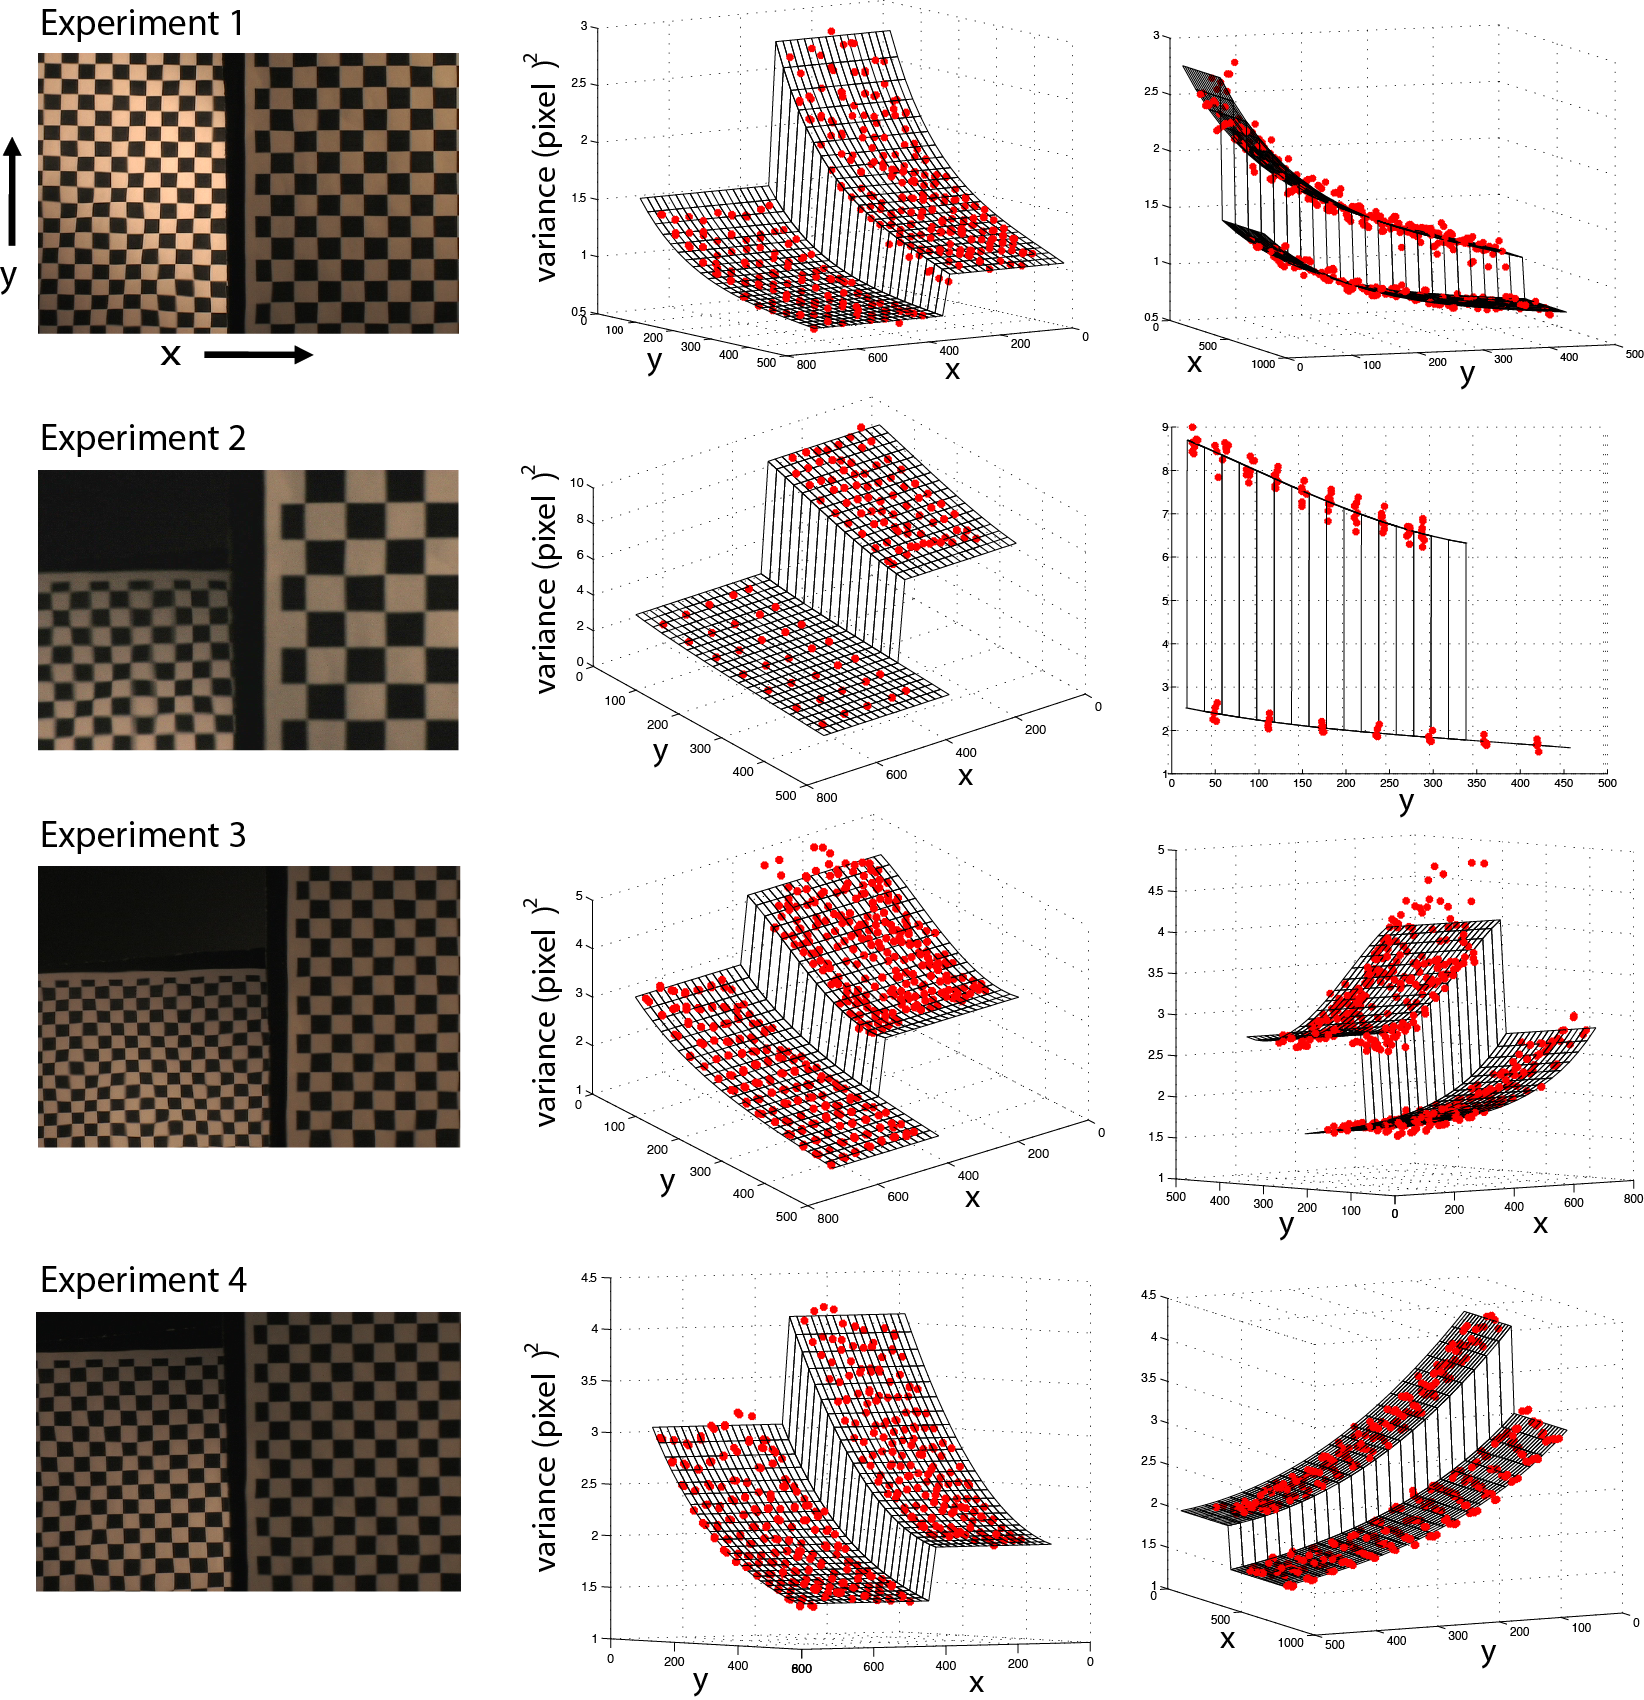
Finding depth discontinuity
Experiments with two planar checker-boards placed at different distances from the
camera. Rows correspond to different experiment settings. The first column shows a sample distorted frame, the
second and third columns show two views of the variance distribution of the corners of
the checker-boards. In all cases, variances changes due to depth discontinuity and
height is obvious. We detect the discontinuity and fit smooth surfaces to the
variances. The ratio of variances of the two depth planes are then computed and
quantitatively compared to the ground truth (See the paper for more details).
|
|
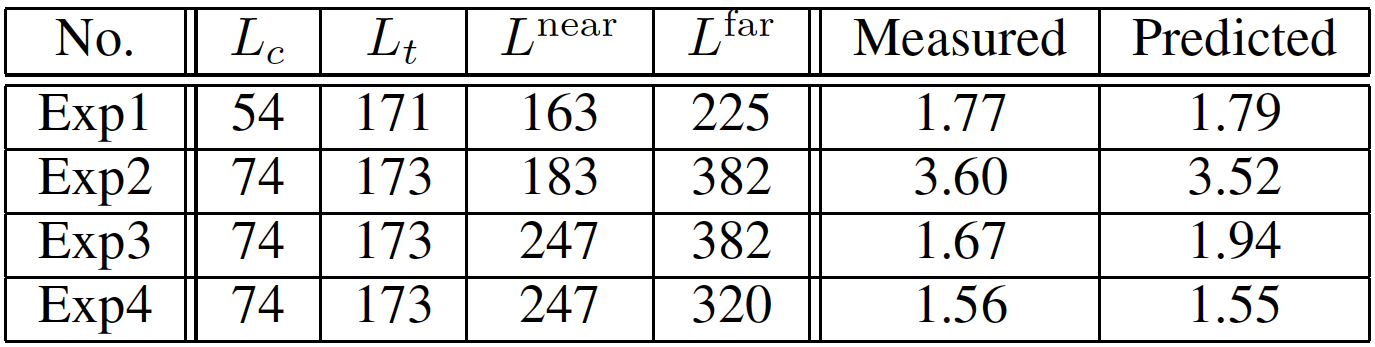
Comparison between estimated depth ratio and groundtruth depth ratio
In the table, columns 1-4 show the ground truth measurement (in centimeters) for the four checker-board
experiments. Columns 5-6 show the comparison between the measured (5th column) variance ratio and
that predicted by the model (6th column). In all but one case, the measurements are very accurate.
|

|
Sample frames of the outdoor experiments in the morning
and afternoon. The targets are placed at different distances
from the camera.
|

|
Result for outdoor experiments
Average variance (and its standard derivation) of trackers for outdoor
experiment. The variance ratios between 160m
and 110m turbulence video are 7.86/4.67=1.6857 (30mm aperture captured in the morning) and 69.37/43.68=1.5785
(10mm aperture captured in the afternoon), close to the
distance ratio (160m/110m=1.4545), verifying our model.
|

|
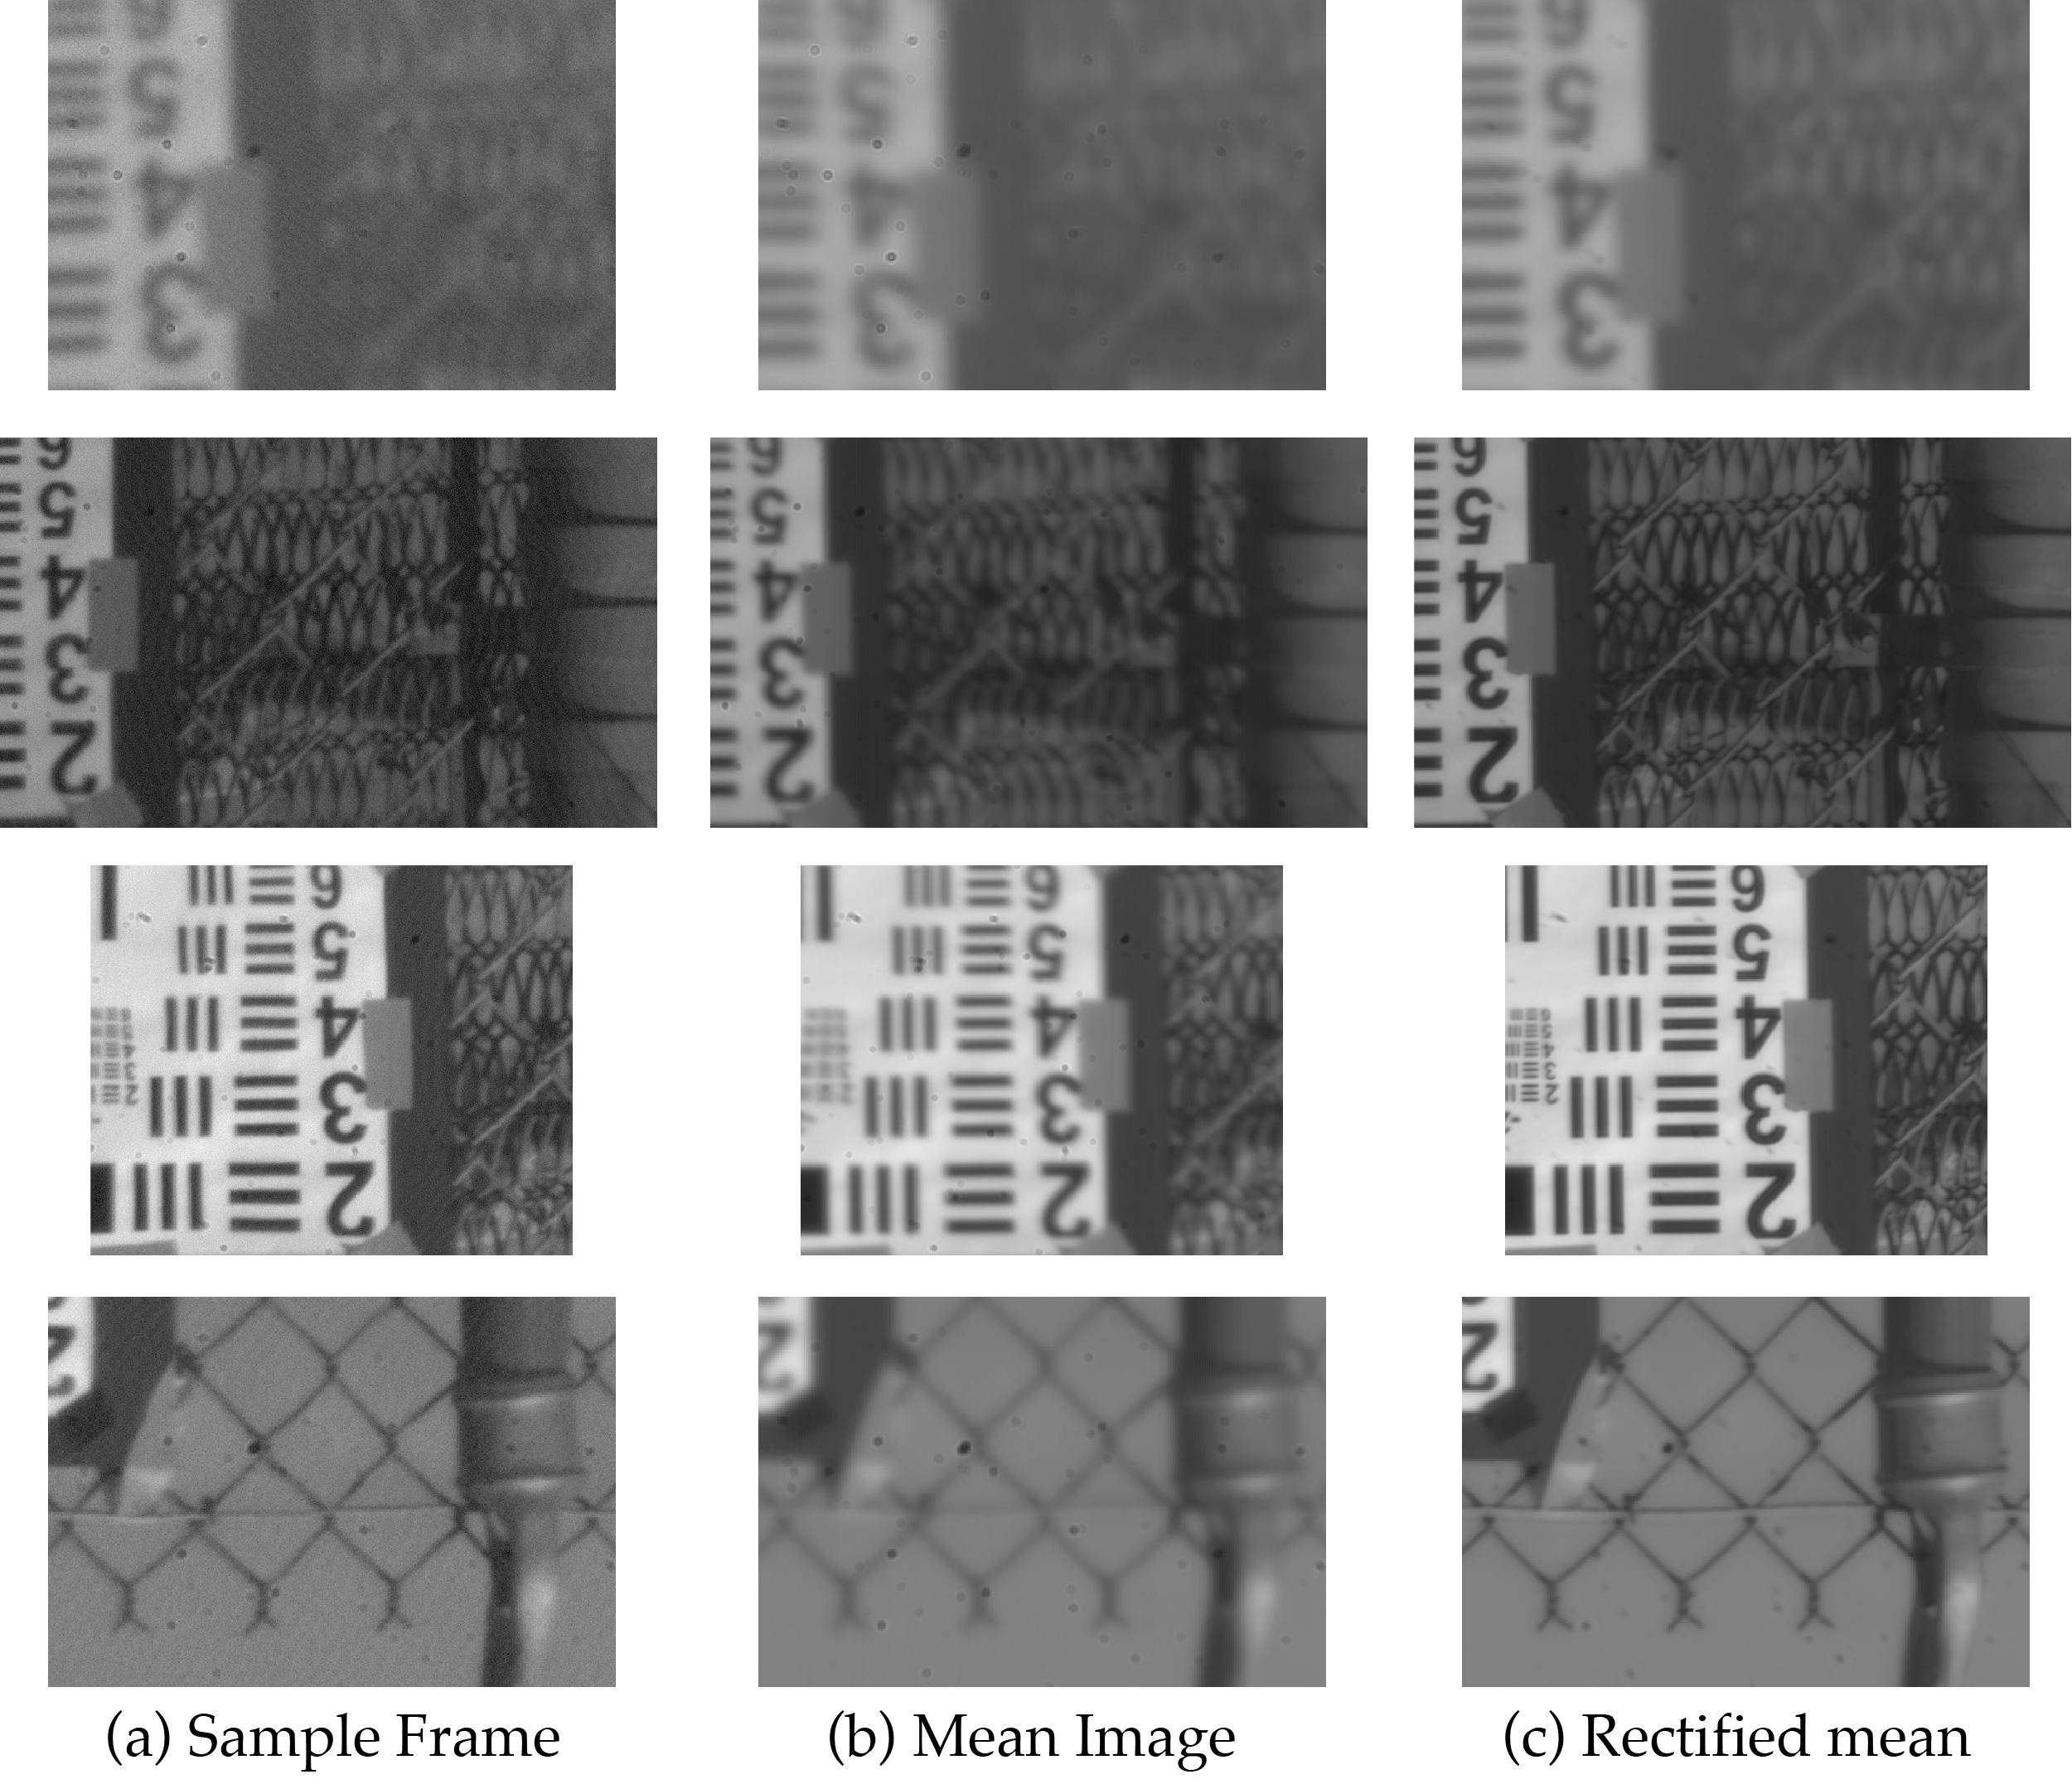
Scene rectification from video sequence captured in turbulence
Frames in video sequence captured in the turbulence region are distorted. Taking the mean frame gives a less distorted image with more blurring. If we register the frames with respect to the mean frame using our Data-driven Descent algorithm and then take the mean, then the result is both less distorted and less blurred.
|
|
|