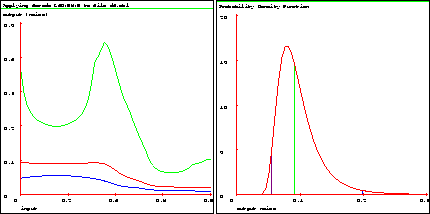
Figure 20: a) Noise estimates for a 1-d function with confidence intervals, b) Distribution of noise at input query 0.15
The noise estimate from a regression is a gamma distribution on the inverse
of the variance of the noise, ![]() . Vizier computes noise
estimates with localized versions of statistics from classical regression
analysis. Fig. 20a shows noise estimates for d4.mbl.
. Vizier computes noise
estimates with localized versions of statistics from classical regression
analysis. Fig. 20a shows noise estimates for d4.mbl.
Model -> Graph -> Dimensions  1
                  Graph type  Noise
                  Show confidence  ON
                  Show datapoints  OFF
                  Graph
The Vizier graph may not match the figure exactly. In order to make them the same, adjust the x axis to a range of 0 to 0.8 and the z axis to a range of 0 to 0.5. Vizier is happy to plot the data points on this graph, but we turned it off because it doesn't make much sense. The data points would be plotted using the vertical axis as the output value of each point, while the noise estimate curves use the vertical axis as the estimated standard deviation at the input indicated by the horizontal axis.
The noise estimate graph shows the predicted, and high and low confidence intervals for the noise (standard deviation). The noise is higher near the left side of the graph where there was obvious noise in the data, and lower near the right side where the data appears noiseless. As before, the confidence intervals get wide where there is little data and near the edges.
Just as with the prediction, we can look at the distribution for the noise estimate at a single input query, as shown in fig. 20b.
Edit -> Query -> ``input'' 0.15
Model -> Graph -> Dimensions 0
In order to make the Vizier graph match the figure, the x axis should be scaled to a range of 0 to 0.3. As before, the predictions and confidence intervals in fig. 20b match those in fig. 20a at input point 0.15. Notice that this distribution is not symmetric. The upper confidence bound on the noise is usually farther above the predicted noise, than the lower confidence bound is below it.