Carnegie Mellon Unveils Five Interactive COVID-19 Maps County-Level Data Will Be Used To Forecast Disease Activity
Byron SpiceThursday, April 23, 2020Print this page.
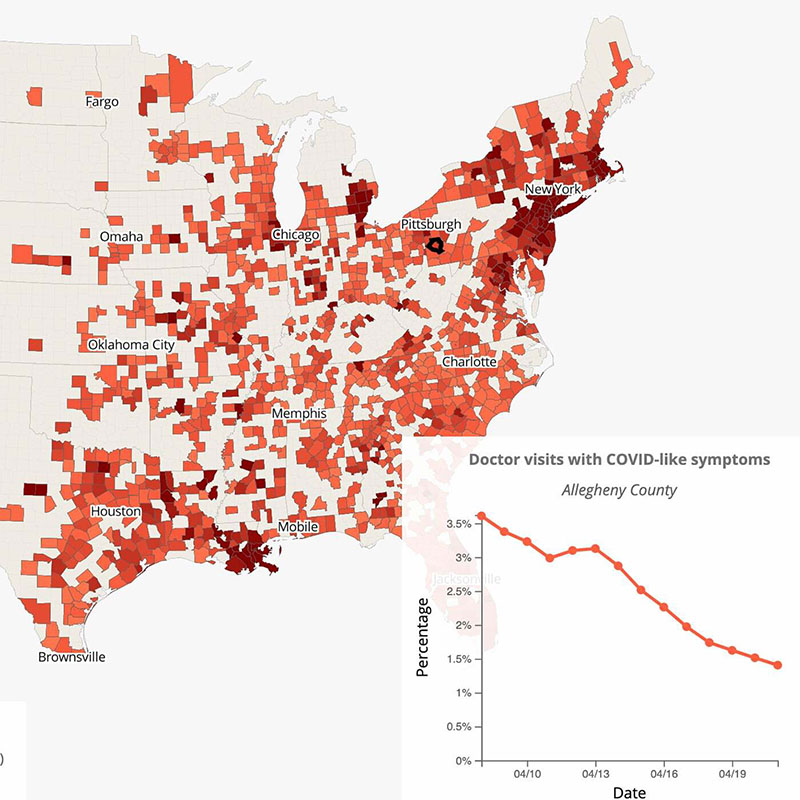
Carnegie Mellon University today unveiled five interactive maps displaying real-time information on symptoms, doctor visits, medical tests and browser searches related to COVID-19 in the United States, including estimated disease activity at the county level.
The maps on CMU's COVIDcast website include data developed with the help of partners including Google, Facebook, Quidel Corp. and a national health system. The data, which is updated daily, will provide the general public and decision makers with a new and unique means of monitoring the ebb and flow of the disease across the country.
"COVIDcast leverages Carnegie Mellon's leadership in machine learning, statistics and data science, and builds upon our partnership with the Centers for Disease Control and Prevention (CDC) in epidemic forecasting at a time when policy makers and health care providers are eager for more insights into the spread of COVID-19," said CMU President Farnam Jahanian. "Our multidisciplinary team of researchers has worked tirelessly to bring together a variety of data sources to support informed decision-making throughout our global society."
Visitors to COVIDcast can use tabs to select which data source is visualized on the U.S. map; to display the data at the level of states, metropolitan areas or counties; and to show either intensity of activity or whether activity is rising or falling.
COVIDcast was created by Carnegie Mellon's Delphi Research Group and its COVID-19 Response Team, which drew many volunteer faculty, students and staff in recent weeks. The team has collected, analyzed and, in some cases, created these data sources to paint a more complete, detailed and up-to-date picture of current COVID-19 activity.
The group plans to use this enhanced information in forecasting disease activity. These forecasts will provide up to four weeks of advance warning to hospitals in a given locale that they likely will see increases in the number of people requiring hospital care.
"This is not the finish line for us — it's just the beginning," said Ryan Tibshirani, co-leader of the Delphi group and an associate professor of statistics and machine learning. The forecasts, as well as "nowcasts" that attempt to provide a combined, integrated view of current conditions, promise to provide important guidance as government and health care officials plan next steps in addressing the pandemic.
Jodi Forlizzi, professor and director of CMU's Human-Computer Interaction Institute, led the team that created the visualizations of the data sources.
The data sources include responses to CMU surveys by users of Google Surveys, and by users of Facebook. The surveys, hosted by CMU, ask people if they know someone who is experiencing fever, cough and other symptoms related to COVID-19. About 600,000 Google users reply each day to the one-question survey: "Do you know someone in your community who is sick (fever, along with cough, or shortness of breath, or difficulty breathing) right now?"
These self-reported symptoms enable the CMU Delphi group to make estimates of disease activity, which they have shown are strongly correlated with test-confirmed cases of COVID-19.
Delphi began reporting the survey results from Facebook users earlier this week. About a million Facebook users a week have responded to CMU's multiple-question surveys regarding symptoms; Facebook is displaying the estimates generated by Delphi based on those results.
Another data source for the maps is Google Health Trends, which has provided data for the Delphi group's influenza forecasts for the past five years. For the latest forecasting project, Delphi uses the Google Health Trends interface to estimate how often people in a given location and on a given day search Google for topics related to COVID-19.
A national health system also is providing statistics on patient visits to doctors and telemedicine visits. This enables the CMU Delphi researchers to estimate the percentage of visits for COVID-19 related symptoms in any given location for a given day.
Quidel Corp., a medical test maker, provides the group with statistics on influenza tests. Flu tests are routinely ordered for people suffering COVID-19 symptoms as a means of excluding flu as a diagnosis, thus requests for flu tests are indicators of possible COVID-19 activity.
"All of these signals are just rough indicators of COVID-19," emphasized Roni Rosenfeld, co-leader of Delphi and head of CMU's Machine Learning Department. "Any one data source may not be conclusive, but if multiple sources indicate the same thing, people can have greater confidence about what is happening or will soon happen in various locales."
Tibshirani and Rosenfeld said they expect to add several additional data sources in the weeks ahead as they prepare to begin forecasting. The Delphi group is continuously providing all of its estimates in a computer-accessible way to anyone. Details are available on GitHub.
The Delphi Research Group has been performing epidemic forecasts for the past eight years, most notably for each influenza season. Last year, the CDC named Delphi one of two National Centers of Excellence for Influenza Forecasting. At the CDC's request, the group this spring extended and adapted its flu forecasting efforts to encompass COVID-19.
Byron Spice | 412-268-9068 | bspice@cs.cmu.edu<br>Virginia Alvino Young | 412-268-8356 | vay@cmu.edu