


Next: Interpretation
Up: Analysis of Competition Performance
Previous: Analytic Framework
The results of performing the Wilcoxon tests, in order to compare speed performance between fully-automated planners, are shown in Figure 4. The results of similar tests to compare plan quality are presented in Figures 5 and 6. The double hits data are presented in Figure 6. The corresponding tests for the hand-coded planners are shown in Figures 7 and 8.
Figure 4:
Table showing results of statistical tests for the comparison of speeds of planners. Bolded results are those that are not significant at p = 0.001 level. Each cell represents a pair of planners being compared. It presents the Z-value and corresponding p-value identified from the Wilcoxon statistical table. The order of the planners' names in the title of the cell is significant: the first planner named is the one favoured by the comparison. Underneath the cell is an entry indicating the size of the sample used. ` ' indicates a result less than 0.001.
 |
Figure 5:
Table of results of statistical tests of comparisons of plan quality across problems solved by at least one planner in each pair. Bolded results are those that are not significant at the p = 0.001 level. `' indicates a result less than 0.001.
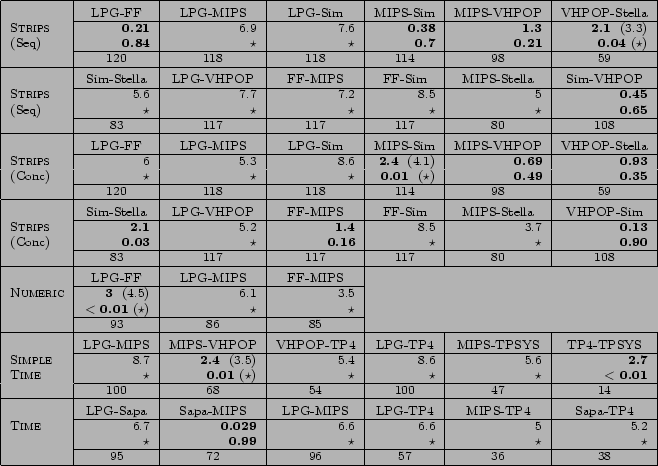 |
Figure 6:
Table showing results of statistical tests of comparisons between quality of plans from pairs of planners considering only problems solved by both planners. Each cell represents a pair of planners being compared. It presents the Z-value and corresponding p-value identified from the Wilcoxon statistical table. The order of the planners' names in the title of the cell is significant: the first planner named is the one favoured by the comparison. Underneath the cell is an entry indicating the size of the sample used. `' indicates a result less than 0.001.
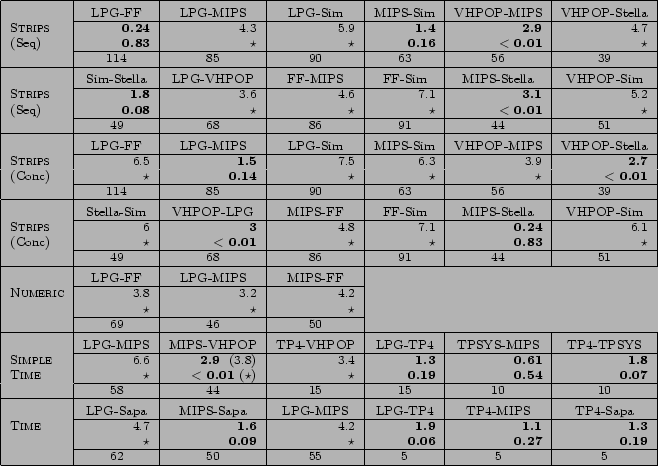 |
Figure 7:
Table showing results of statistical tests for the comparison of speeds of hand-coded planners. `' indicates a result less than 0.001.
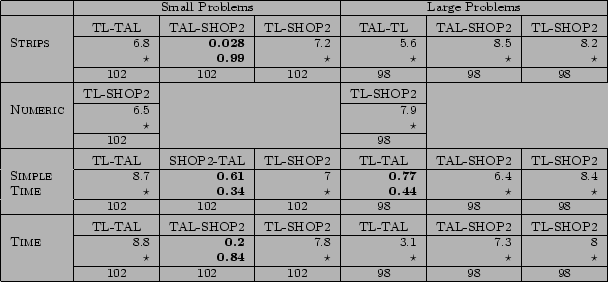 |
Figure 8:
Table showing results of statistical tests on comparative quality of plans produced by hand-coded planners. This table shows results for problems solved by at least one of the planners -- results restricted to problems solved by both are insignificantly different, since the hand-coded planners all solved almost all problems attempted. `' indicates a result less than 0.001.
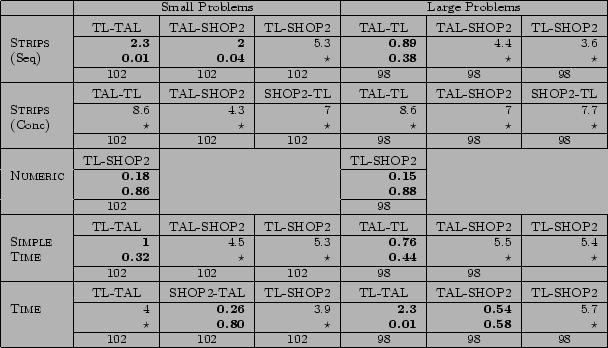 |
The tables have rows corresponding to the four problem levels for which the competition gathered sufficient data for analysis. These are: STRIPS, NUMERIC, SIMPLETIME and TIME. There are so many results for the fully-automated planners on STRIPS domains that they are split over two rows, creating five rows in these tables. In the comparisons of plan quality we report the STRIPS results using sequential plan length and concurrent plan length separately. The data in the rows are interpreted in the following way. Each cell, representing a pair of planners being compared, presents the Z-value and corresponding p-value identified from the Wilcoxon statistical table. The order of the planners' names in the title of the cell is significant: the first planner named is the one favoured by the comparison. Underneath the cell is an entry indicating the size of the sample used. The sample consists of all problems for which at least one of the planners being compared produced a solution: this results in there being different sample sizes for different comparisons. If the p-value is no greater than 0.001 then the difference in the mean performances obtained by the competing planners is statistically significant and it can be concluded that the planner in that column is significantly out-performing its competitor. If the p-value is greater than 0.001 the difference is not significant, in terms of the transitive view in which we are interested, and the null hypothesis that the planners are performing roughly equally cannot be rejected. We indicate the absence of significance at the  level by the use of a bold font.
The Wilcoxon test tells us when there is a significant difference in mean behaviour but it does not identify the planner producing the greater proportion of wins in cases where the mean behaviour is insignificantly different. Therefore, when the Wilcoxon tests reports that there is no significant difference between a pair of planners we also report the Z-value of the proportion (see Appendix C), if significant, to provide this missing information. Where we do this the Z-value of the proportion, and its p-value, appear in brackets following the Wilcoxon result.
Next: Interpretation
Up: Analysis of Competition Performance
Previous: Analytic Framework
Derek Long
2003-11-06