RESEARCH
SAGE
Data
SAGEBRUSH
Model
SAGEBOOK
Visage
SDM
Autobrief
VQE
Solar plots
Applications
SAMPLES
PAPERS
PEOPLE
HOME

SageBrush (also called Brush) is a design tool interface in which users
specify graphics by constructing sketches from a palette of primitives and/or
partial designs. This allows users to create a large number of possible
combinations of graphical elements, customize their spatial and structural
relationships, and map them to the data they wish to visualize.
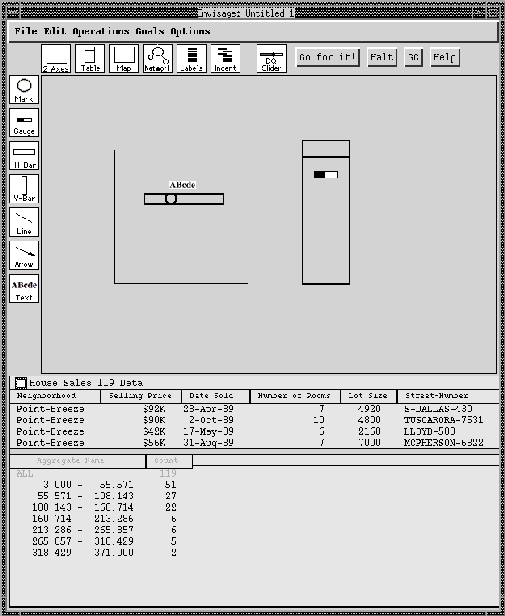
Below is a representation of SageBrush (click on the figure to see a larger version). Brush's interface consists of a design work area (center) into which users drag prototypes (top), graphemes (left), and data names (bottom).
Prototypes are partial designs, each with a spatial organization, graphemes,
and/or encoders that commonly occur together. Encoders are references for
interpreting properties of graphemes. For example, axes enable us to interpret
(i.e., derive a data value from) the position of a bar in a chart. The work
area currently contains two prototypes: a chart with a horizontal bar grapheme,
a mark grapheme, and a text grapheme; and a table with a gauge grapheme.

See related papers by subject

