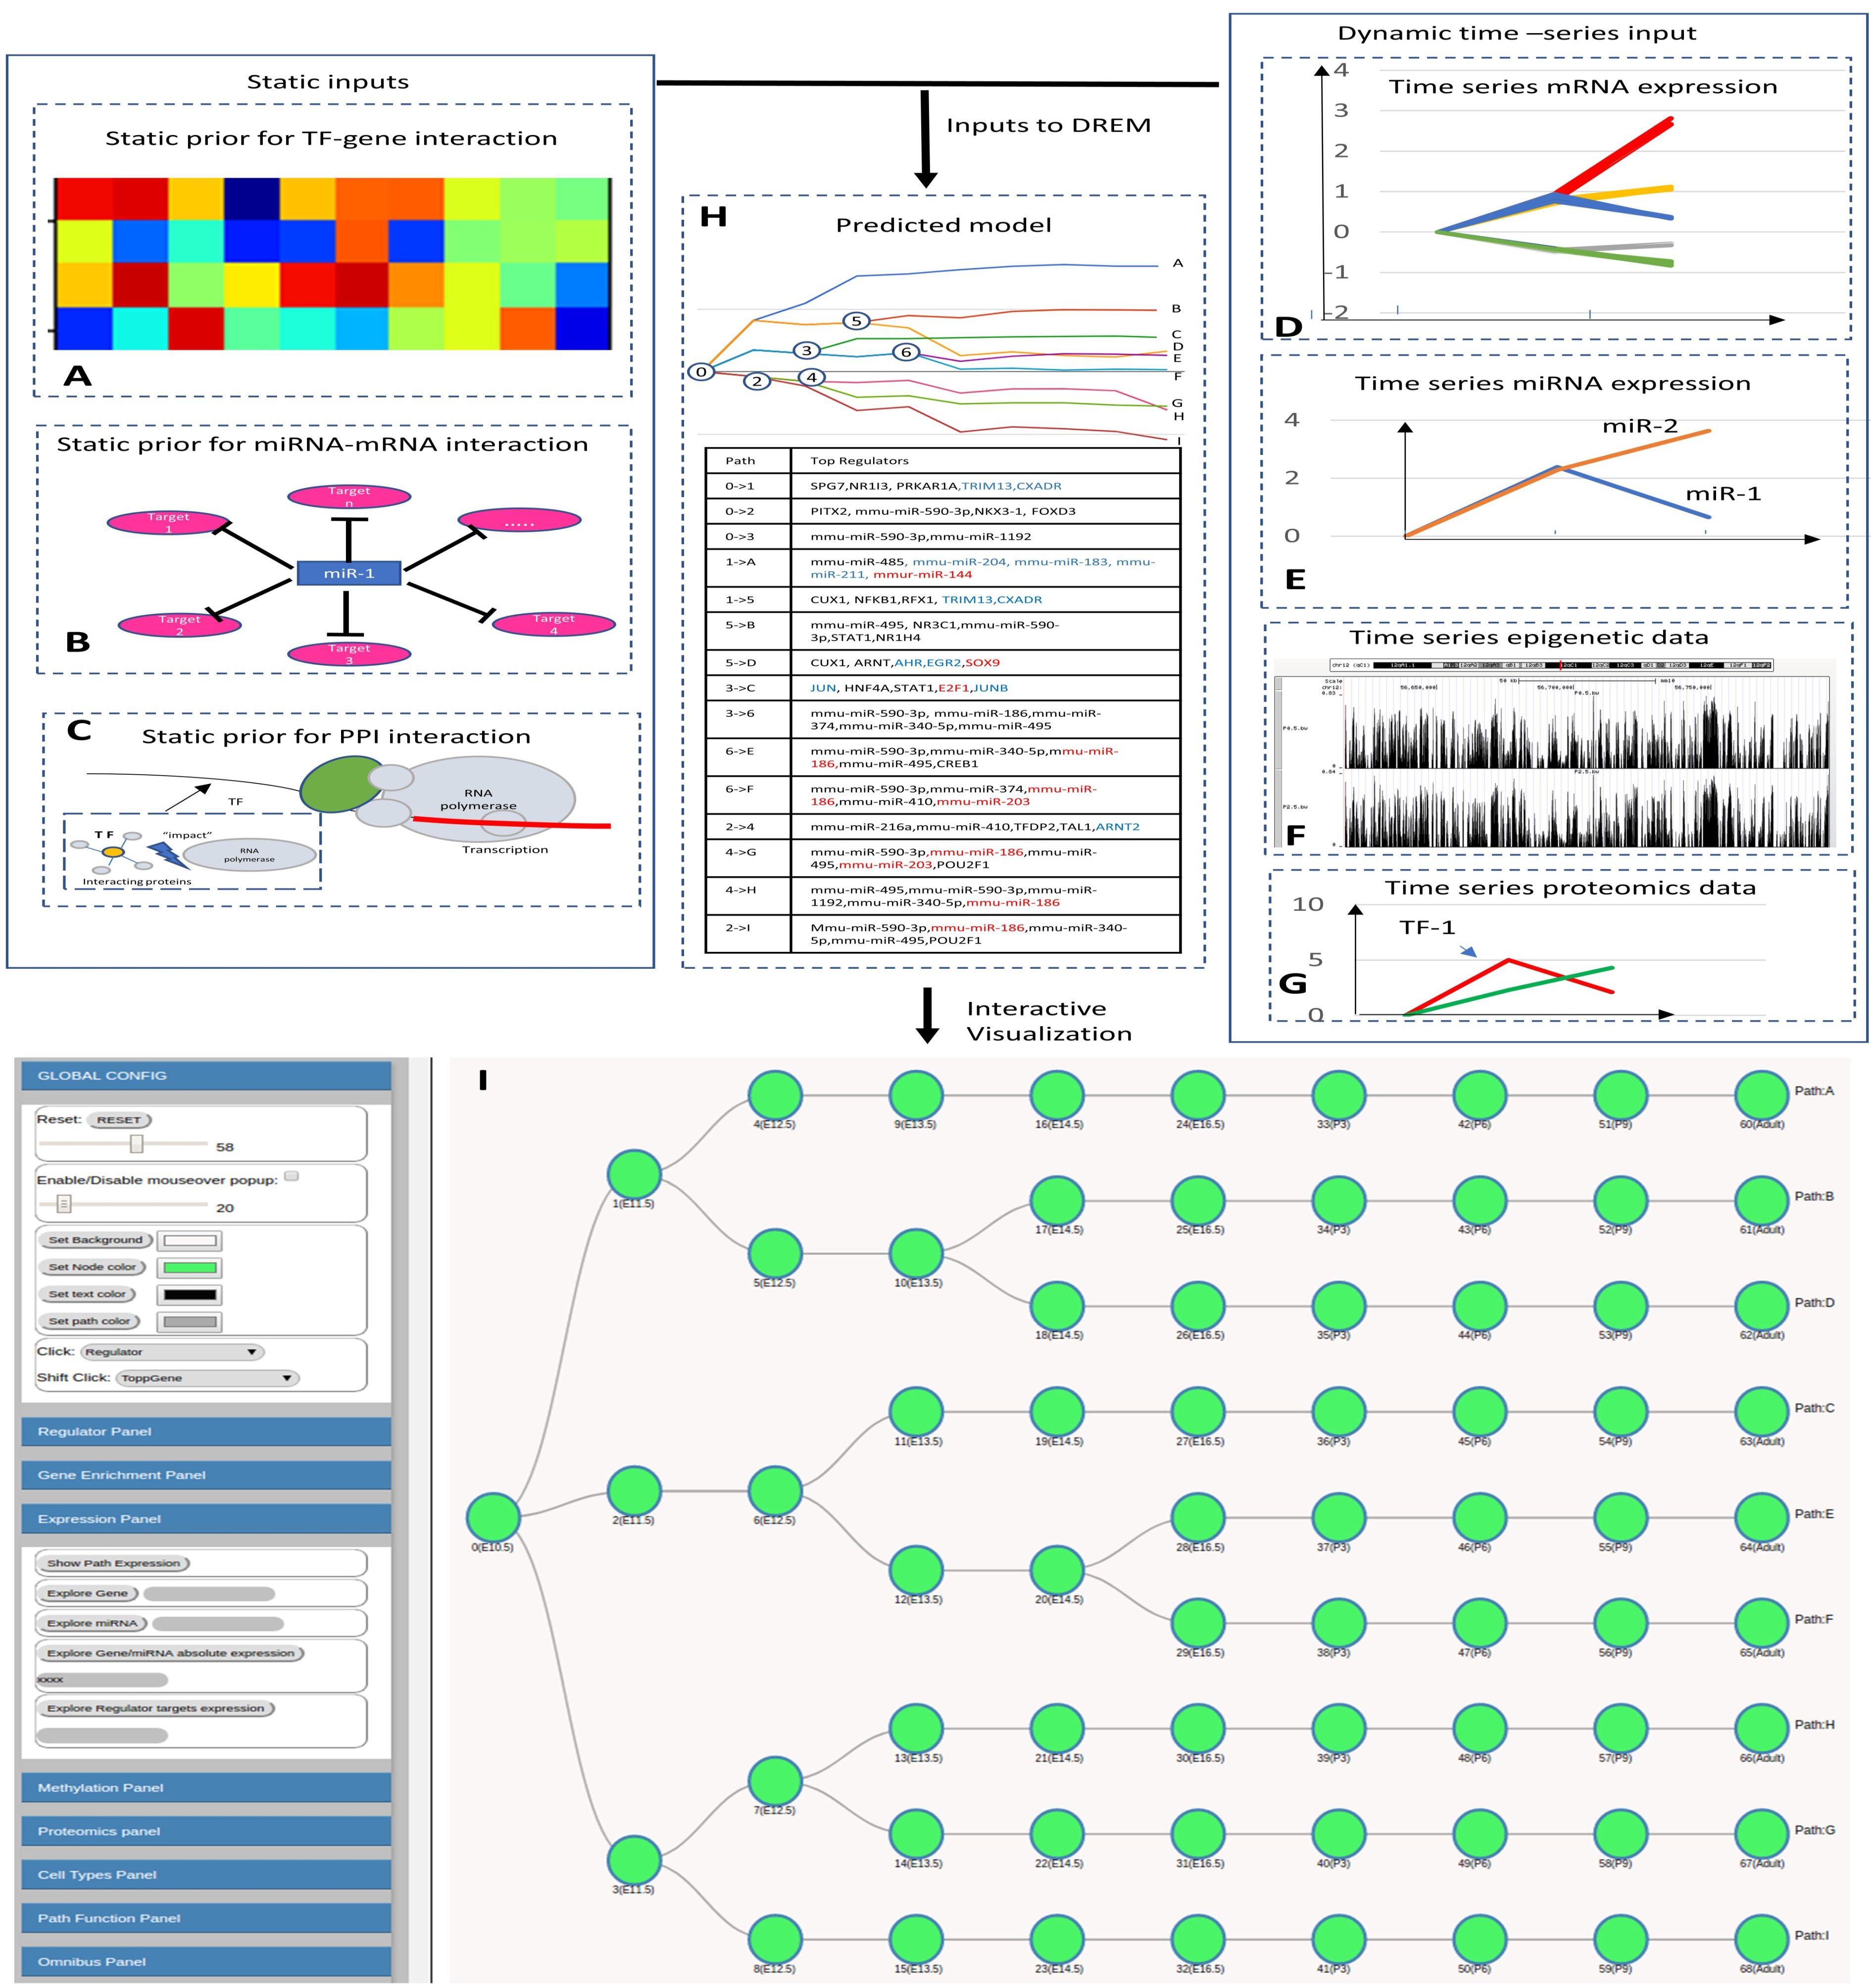
Interactive visualization of dynamic regulatory networks
The Dynamic Regulatory Events Miner (DREM) software was initially developed to
integrate static protein-DNA interaction data with time series gene expression data for
reconstructing dynamic regulatory networks. In recent years, several additional types of
high-throughput time series data have been used to study biological processes including
time series miRNA expression, proteomics, epigenomics and single cell RNA-Seq.
Integrating all available time series and static datasets in a unified model remains an
important challenge and goal. To address this goal, and to enable interactive queries
of the resulting learned models we have developed a new version of DREM termed
interactive DREM (iDREM). iDREM provides support for all data types mentioned
above and more. Importantly, it also allows users to interactively visualize a gene,
TF, path or model-centric view of each of these data types, their interactions and
their impact on the resulting model. We showcase the functionality of the new tool by
applying it to integrate several data types from multiple labs for modeling microglia
development regulatory networks.