 Download PDF
Project Proposal
1 Summary
We plan to implement an instrumentation strategy for Google’s V8 JavaScript engine. This will allow us to produce evidence to either support or reject the hypothesis that the optimizations utilized in industrial scripting engines produce speed gains for production code of the same magnitude as they do for current benchmarks.
Project Page: http://www.cs.cmu.edu/~ishafer/compilers/
2 Project Description
Throughout 15-745 we have focused on optimizations for static languages within the highly adaptable LLVM research platform. This framework has provided the ability to study optimizations and how they improve the performance of code. In this project, we plan to focus on evaluating optimization effectiveness for dynamic languages using a production compiler. This is an important research topic because the impact of recent optimizing compilers for dynamic languages on production code has not been studied in depth.
We have chosen to investigate JavaScript, which is a particularly important dynamic language as it has emerged as “the language of the Web” and more. Modern web applications are built in JavaScript or language layers built atop the language. JavaScript is emerging on more platforms: as the framework for writing desktop applications (Windows 8 Metro applications), mobile applications (PhoneGap and kin), server side code (node.js), databases (MongoDB), and even for systems programming (HP WebOS). We will instrument V8, a popular compiler that we can modify.
Our work will analyze production compilers and web applications. Many existing studies (see 5) have found that existing applications used to evaluate compiler effectiveness do not represent real usage. Using a production compiler affords us the opportunity to test optimizations that are used in practice as opposed to using an easier-to-instrument trivial runtime. We believe this work will help identify a few ineffective optimizations and contribute to a better understanding of optimizing dynamic languages. It will also primarily involve work within a compiler for a dynamic language, and grant us insight into its operation.
3 Plan of Attack and Schedule
| Week Beginning | Plan for the Week |
| March 26 | Learn where and how to instrument V8, produce a simple modification (such as emitting information from within an optimization) |
| April 2 | Turn off all runtime optimizations, and build framework for selectively enabling single optimizations. Test one optimization. Identify metrics for evaluation. |
| April 9 | Identify set of real-world applications and apply selective optimization to a few of them. Begin instrumenting metrics for evaluation (e.g. number of instructions executed) to determine benefit of optimizations. |
| April 16 | Continue running set of real-world applications with instrumentation. Finish instrumenting evaluation metrics. If time, begin experimenting on another platform (see 6). |
| April 23 | Transform raw data into condensed results, establish results. If time, finish experimenting with other platform. |
| April 30 | Complete project writeup and poster |
4 Milestones
For the project milestone on Thursday, April 19, we plan to have completed the framework for evaluating optimizations, and have experimented with one or two real-world applications.
5 Related Work
There is quite a bit of evidence in previous work that strongly suggests current benchmarks are not representative of production JavaScript [5, 7]. Several of the studies that examined the behavior of JavaScript at runtime also produced some evidence that existing optimizations actually make production code slower [4, 3]. To address the problem of poor benchmarks, work has been done to create better research compilers to aid development and experimentation [1] and towards automatically producing benchmarks using traces from executions of production scripts [6]. Unfortunately for optimizing compilers, it turns out that production JavaScript, in addition to being very dynamic, makes heavy use higher-order operations such as document.write and eval [2]. Currently there seems to be no published work that attempts to conclusively measure whether optimization suites or specific optimizations are effective or actually harmful for speeding up production scripts.
6 Resources Needed
We will need a copy of the V8 compiler framework. V8 is open-source, and has been integrated with many of the environments we are targeting. We will begin our work on standard (i.e. our own) machines. If we extend our work to other platforms, we will need one or more of these tools:
- node.js: a server-side JavaScript implementation, which is open-source (and, in fact, is by default a source install). It uses V8 as its engine.
- Android: we would experiment within an Android emulator, which is freely available.
- MongoDB: MongoDB is open-source; to modify the V8 portion its JavaScript engine can be switched to a modified version of V8.
7 Getting Started
Thus far, we have read seven recent papers from the area. We have also taken some initial steps towards the initial implementation aspects of the project:
- We have installed node.js from source and tested basic (hand-written) applications
- We have installed the Android emulator
- We have begun identifying relevant areas within the V8 source
Our next step is to begin modifying V8. Though we anticipate encountering obstacles as we delve further, we do not have any constraints that prevent us from starting immediately.
References
[1] M. Chevalier-Boisvert, E. Lavoie, M. Feeley, and B. Dufour. Bootstrapping a self-hosted research virtual machine for JavaScript: an experience report. In DLS, pages 61-72, New York, NY, USA, 2011. ACM.
[2] H. Kikuchi, D. Yu, A. Chander, H. Inamura, and I. Serikov. JavaScript instrumentation in practice. In APLAS, pages 326-341, Bangalore, India, 2008. Springer-Verlag Berlin / Heidelberg.
[3] J. Martinsen. A methodology for evaluating JavaScript execution behavior in interactive web applications. In AICCSA, pages 241-248, Sharm El-Sheikh, Egypt, 2011.
[4] J. K. Martinsen, H. Grahn, and A. Isberg. Evaluating four aspects of JavaScript execution behavior in benchmarks and web applications. In ICWE, pages 399-402, Paphos, Cyprus, 2011. Springer.
[5] P. Ratanaworabhan, B. Livshits, and B. G. Zorn. JSMeter: comparing the behavior of JavaScript benchmarks with real web applications. In WebApps, page 3, Berkeley, CA, USA, 2010. USENIX Association.
[6] G. Richards, A. Gal, B. Eich, and J. Vitek. Automated construction of JavaScript benchmarks. In OOPSLA, pages 677-694, Portland, OR, 2011. ACM.
[7] G. Richards, S. Lebresne, B. Burg, and J. Vitek. An analysis of the dynamic behavior of JavaScript programs. In Proceedings of the 2010 ACM SIGPLAN conference on Programming language design and implementation, PLDI ’10, pages 1-12, New York, NY, USA, 2010. ACM.
Milestone Report
1 Major Changes
We have no significant changes to our project plan. The primary broad revision to our plan is that we do not expect to focus on experimenting with another platform (e.g. node.js) given time constraints and the unforeseen obstacles we have faced in adding instrumentation and running tests (see Section 4).
2 What We Have Accomplished So Far
The revised schedule in section 5 summarizes our accomplishments to date fairly succinctly. We successfully acquired and compiled both Chromium and V8, and we have learned key elements of both projects. Having obtained sufficient insight into the inner workings of the compiler and its broader context, we instrumented the build of Chromium we use for testing. We have written a series of tests (using a tool called Sikuli) to perform typical operations on real world web applications. In combination with these pieces, we have constructed a framework to toggle optimization passes in V8, and are currently using it to mostly automatically run our test cases. We are currently collecting benchmarking data in the form of internal counters and the time required to run V8 operations such as compiling or running JavaScript. A brief preview of our results so far is available at http://www.cs.cmu.edu/~ishafer/compilers/#report
3 Meeting our Milestone
In our project proposal, we wrote:
For the project milestone on Thursday, April 19, we plan to have completed the framework for evaluating optimizations, and have experimented with one or two real-world applications.
We have met (and slightly exceeded) this milestone. Our basic framework for evaluating optimizations is complete, and we have experimented with the four real-world applications (and benchmark) described in Section 2.
4 Surprises
One significant surprise thus far has been the difficulty of instrumenting the V8 compiler within a browser. Though V8 contains a profiler that can be used by developers from an in-browser utility, and the V8 command-line shell has support for reporting many internal counters, these are not exposed by Chromium. We have adapted the internal-counter reporting framework from the V8 shell into the Chromium source and added an additional counter for the number of times on-stack replacement with deoptimized code occurs (we will describe the significance of this counter in the final report). Furthermore, we cannot collect counters and profiling information simultaneously.
Another unanticipated obstacle has been the painfulness of testing with real-world applications. After our initial discussion we de-emphasized the benchmarking aspect of the project to instead focus on selective optimization. Unfortunately, simply getting to the point of running consistent real-world scenarios has required writing UI-based tests, which have been exceptionally temperamental. We have automated the tests, but real web applications have significant response-time variation and occasionally our UI testing framework’s computer vision engine fails to find click targets. This means seemingly simple behaviors like “click a submit button once an image has been uploaded” have required care and supervision of tests.
5 Revised Schedule
| Week Beginning | Plan for the Week |
| March 26 | Done: Turn off all runtime optimizations, and build framework for selectively enabling single optimizations. Build test scripts to perform typical operations on real web applications. |
| April 2 | Done: Identify metrics for evaluation. Learn where and how to instrument V8, produce a simple modification (such as emitting information from within an optimization). Test one optimization. |
| April 9 | Done: Identify set of real-world applications and apply selective optimization to a few of them. Begin instrumenting metrics for evaluation (e.g. number of instructions executed) to determine benefit of optimizations. |
| April 16 | Continue running set of real-world applications with instrumentation. Finish instrumenting evaluation metrics. If significant extra time, begin experimenting on another platform |
| April 23 | Transform raw data into condensed results, establish results. If time, finish experimenting with other platform. |
| April 30 | Complete project writeup and poster |
6 Resources Needed
We will need no additional resources to complete the project. In addition to our additional list of required resources, we have obtained a few VMs for testing purposes. We will explain how these were used in the final report.
Instrumenting V8 to Measure the Efficacy of
Dynamic Optimizations on Production Code
Abstract
As JavaScript has risen to dominance as the language of the Web, popular web browsers have responded by introducing a variety of compilers designed to optimize JavaScript speed. Public one-upmanship has played out between these browsers on the basis of performance on a few benchmarks. Surprisingly, how well JavaScript compilers fare on real-world web applications has received little attention.
Here we study the impact of one widespread JavaScript compiler in six scenarios using a novel testing framework. We find that the impact of optimization is very small — and sometimes even harmful. Classic optimizations used in static compilers fare poorly and the time taken to do compilation has become a prominent factor. Our findings not only highlight the importance of better benchmarks, but also point out more real-world foci in optimization than current efforts have examined.
1 Introduction
JavaScript has emerged as the lingua franca of the World Wide Web. The highly dynamic client-side interactions that define many popular websites, such as Gmail and Facebook, are made possible by extensive and complex use of the language. Furthermore, JavaScript has broken through into other domains where statically compiled languages have traditionally held sway, like Windows desktop applications [19], mobile applications [5] and services [13], server-side code [7], and more. In light of its emerging popularity, a flurry of recent work has focused on producing (and improving) optimizing compilers for JavaScript [11, 9, 3, 14, 10, 6]. Though the details of their techniques vary, these compilers are just-in-time (JIT) engines that generate optimized native code at runtime.
After ensuring the correctness of its output, the clear criterion for a successful optimization pass made by such a compiler is improved performance of the resulting code. For representative workloads, optimized code should improve some metric — here we consider execution time. When optimizations happen at runtime, measuring whether optimizations have been successful is even more important, since dynamic optimization requires overhead to actually perform the compilation that could have instead been occupied by interpretation or execution of unoptimized code. Furthermore, many optimizations for dynamic languages are optimistic: under certain conditions the compiler must perform an expensive replacement of optimized code with unoptimized code to account for an exceptional condition that renders the optimized code invalid.
In light of the challenges facing effective optimization, surprisingly little effort has focused on how well recent optimization techniques fare on the real-world, popular workloads like Gmail and Facebook. Though evaluations of compilers and optimizations include some form of efficacy analysis, for JavaScript they are typically restricted to workloads that do not represent actual web applications. To our knowledge, ours is the first study that has focused on the efficacy of optimizing compilers for JavaScript for real-world scenarios.
To that end, we make two primary contributions in this work. First, we design and implement a framework for evaluating optimization efficacy for real-world applications from a production compiler. Second, we apply this framework to six web application scenarios to generate a number of insights about compiler behavior in V8:
Optimization has limited benefit: For popular real-world web applications the optimizer has a very small benefit or even negatively impacts performance, even while producing drastic improvements in widely-used benchmark code.
Many optimizations diminish performance: Traditional optimizations that produce benefits in compilers for static languages have little or negative impact on real-world dynamic web applications. Furthermore, the choice of optimizations that is useful for targeting benchmark improvement is not necessarily the best for typical production web applications.
Compiler overhead is significant: Time taken for compilation is significant compared to code execution time, and is primarily caused by the time required to manage large amounts of code. Attempting to perform more extensive compilation increases this overhead due to both optimization and deoptimization.
After introducing JavaScript and the V8 compiler in Section 2, we describe our framework and instrumentation approach in Section 3. Section 4 delves into the insights summarized above, which produce a number of directions for work on JavaScript compilation. We highlight a few promising ones in Section 6.
2 Background
We study JavaScript, as it is used to some extent in almost all of the most widely-visited websites [17, 1], and particularly heavily by popular web applications [22]. To study the effect of compiler optimization, we use the V8 JavaScript engine [10] within the Chromium browser, which by many indicators recently eclipsed Mozilla’s Firefox as the second most popular browser [23, 24]. V8 is a particularly relevant focus because it is enjoying growing use outside of Chromium [13, 7, 5] and the most widely used JavaScript engine (Microsoft’s Chakra) is not open-source.
2.1 Real-World JavaScript
JavaScript is a dynamically-typed, garbage-collected language with a prototype-based object model [8]. The language is highly dynamic: fields, methods, prototypes, and types can all change at runtime, and arbitrary strings can be executed as code. A number of characteristics of real-world JavaScript make compilation challenging. Foremost, dynamic features prevent trivial static analysis of the code, requiring special cases to handle situations like variables and fields that change type [2]. Widespread use of variadic functions, the eval function to execute text as code, method polymorphism, constructor polymorphism, and runtime changes in object prototypes introduce further challenges [22, 18]. Furthermore, many real-world sites require parsing on the order of megabytes of this sort of JavaScript [22]. To cope with these challenges, V8 performs selective optimization of code through a multi-stage process.
2.2 Compiler Overview
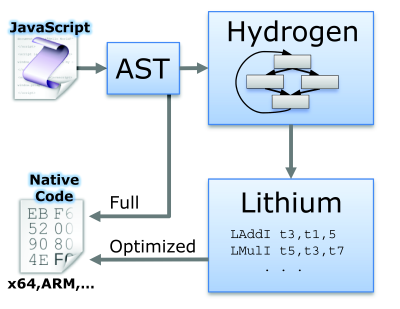
V8 contains two compilers and a runtime engine. The broad architecture is shown in Figure 1. When V8 first examines any JavaScript code, it parses it to an abstract syntax tree (AST) and uses the first compiler, a full code generator. This compilation pathway performs no optimization, and produces native code (e.g., x64, ARM) with full runtime support for JavaScript’s dynamicity. The second pathway is the optimizing compiler, which uses two forms of intermediate code. First, the compiler transforms the AST into a high-level intermediate representation (IR) named Hydrogen. This IR is a graph of basic blocks with code in SSA form and is the vehicle for the optimizations we study. Once the Hydrogen IR has been transformed by optimization passes, it is translated to a low-level three-address code called Lithium. This form is similar to bytecode that would be run in a register VM and is used for register allocation. Finally, to produce optimized code, Lithium is compiled to native code. The native code produced by the optimizing compiler replaces the unoptimized code through a process known as on-stack replacement. On-stack replacement allows code to be optimized and deoptimized even in situations like the middle of an executing loop.
Execution may not always be able to stay within optimized code at runtime. A variety of conditions, such as changes in types, may render optimized code invalid. The optimized code contains guards to ensure that conditions for optimistic optimization still hold. If they do not, a deoptimization process occurs. Code from the full code generator is kept, and on-stack replacement replaces the execution context and stack with the full native code. We do not go into detail here, but the process can be expensive, as we substantiate later.
3 Approach
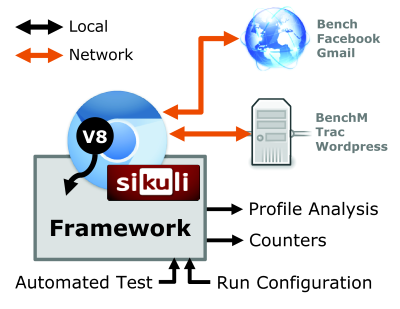
To study the impact of compiler optimizations in V8, we constructed a framework to selectively enable optimizations within the compiler, run real-world scenarios with a certain set of optimizations, and instrument the behavior. An overview of our approach is shown in Figure 2. This framework toggles optimizations within the V8 engine in Chromium and collects both profiling information and a set of internal counters. We enable it while targeting the browser at a variety of application interactions that we script.
3.1 Selective Optimization
The code optimization process in Chromium modifies a Hydrogen IR graph as it is created. We can selectively disable parts of the optimization without compromising the correctness of the resulting code. The first key part of this selective configuration controls whether the optimization path is enabled at all — we can disable it and just use the full code generator. When the optimizing compiler is enabled, we control 11 internal flags that alter how the code is optimized; they are listed in Table 1. Some of these (gvn, licm, range, deadphi) are very similar to the passes used in static compilers. The canonical step is unique to dynamically-typed languages, and although function inlining is certainly not a new concept it requires more care for JavaScript and is a particular focus of the optimizing compiler. This is reflected in the inclusion of 5 flags that control inlining.
| Name
| Description
|
| canonical | After type inference, canonicalize all instructions in the Hydrogen graph to remove all instructions made useless by known type information. |
| gvn | Global Value Numbering — performs global common subexpression elimination |
| licm | Loop-Invariant Code Motion |
| range | Determine the range of each Hydrogen value to aid other optimizations. |
| deadphi | Dead PHI node elimination |
| for_in | Prepare for-in loops with fast (e.g., smi, unwrapped, etc. elements), local each variables for on-stack replacement (other cases can’t be optimized with this pass). |
| use_inline | Attempt any form of function inlining. The four optimizations below control the amount of inlining. |
| limit_inline | Limits how large code can grow by limiting the source size and how many nodes can be added to the Hydrogen instruction graph and AST due to inlining. |
| args_inline | Inline functions even if they use the implicit arguments object (for variadic functions). |
| poly_inline | Attempt to inline polymorphic calls to functions. |
| cons_inline | Attempt to inline constructor calls |
3.2 Real-World Scenarios
With a particular configuration of optimizations, we start Chromium and direct it to load a page. We focus on real-world sites like Gmail and Facebook. To compare the impact of optimization on real-world sites with published results, we also include the V8 benchmark suite. Beyond merely loading a page, we are interested in testing sample real workloads that a browser would experience. Therefore, to emulate a user’s actions we write a series of tests using the Sikuli UI automation tool [4]. These six tests are:
- Bench
- The scenario visits a web page containing the V8 benchmark suite (version 7) and waits until it completes. It primarily does compute-intensive work and data structure manipulation. It does not do a constant amount of work — it runs benchmarks for periods of 1 second until at least 32 executions are run.
- BenchM
- For instrumentation purposes, we desire benchmarks that do a constant amount of work. BenchM is our slightly modified version of Bench that performs a constant amount of work (32 benchmark executions).
- This scenario logs into Facebook as a test user. It then visits the user’s Wall page to create a post and subsequently delete it. Next, it uses the photo upload tool to post a photo and place a tag on the photo. Finally, it removes the photo from the user’s page, refreshes the page, and removes the tag notification from the user’s wall.
- Gmail
- This scenario logs into Google’s Gmail as a test user we created. It waits for the Gmail load sequence to complete, then opens a menu that lists actions for the user’s inbox. It then uses the search feature to find messages before logging out.
- Trac
- We test against an installation of the Trac project management and issue tracker, version 0.12.3. Our local install is on a separate machine in order to not impact Chromium’s performance. The scenario logs into an instances of Trac that was seeded with tickets, searches for an item, and then waits for the search to complete and display results.
- WordPress
- We utilize a local install of the popular WordPress content management system, version 3.3.1. The scenario begins by logging in to WordPress and waiting for the administrative panel to load. It then starts a new post, types in text, and uses a photo uploader tool to insert an image into the post. Finally, it clicks a button to load a preview of the resulting post.
3.3 Instrumentation
To understand how the compiler behaves in the presence of different optimizations, we collect and analyze two forms of instrumentation: traces from a sampling profiler and a set of internal counters that are incremented for certain compiler actions. For all modifications we build Chromium from source at revision 128907.
3.3.1 Profile Traces
For understanding where time is spent in a scenario, we use a profiler. Developers are often interested in understanding where their JavaScript programs spend their time. To support this use case, the V8 runtime contains a sampling profiler that is available within the Chromium browser interface. Rather than attempt to use this UI-based profiler, we enable the internal profiler and configure it to begin profiling on browser startup and dump its output to a log file.
The profiler operates by sampling the execution state of the browser every 2 milliseconds, and records the currently-executing point in the V8 code. Unlike the UI-based profiler, the emitted logs also provide tracepoints within the compiler. This enables us to separate calls into two categories: optimizing compiler calls and JavaScript runtime calls. By aggregating time across all samples, we obtain a breakdown of compilation overhead and execution time as well as functions that occupy the most time. Although a sampling profiler is by nature less accurate, it allows us to run code at near normal execution speed and capture a more accurate trace.
3.3.2 Internal Counters
To obtain a deeper understanding of how optimizations behave internally, we use and add to a set of internal counters maintained by the V8 compiler and runtime. They record various characteristics of compilation (e.g., the size of compiled code), as well as many runtime behaviors that are affected by the optimizing compiler (e.g., the number of deoptimizations). These counters are not collected within the Chromium browser, and to our knowledge are used only by the developers of V8 from a JavaScript interpreter shell. We adapted the counter collection system to the Chromium browser and periodically dump all available counters to an output file. Our analysis framework parses these outputs. We provide further detail about selected counters in analyzing the results of scenario execution.
4 Results
We have applied our framework to the scenarios from Section 3.2. It yielded a number of insights about the real-world performance and behavior of the V8 compiler. We present some of the most striking results here. First, we confirm that optimizations work well for a benchmark suite, but perform far worse for real world applications. Our framework also enables us to focus on how to optimize, and reveals that the default set of optimizations that improves benchmark performance can be inferior to simply leaving optimizations off. Finally, we take a deeper look into the sources of performance degradation and compiler overhead through the lens of our instrumentation.
4.1 Optimization has limited benefit
Dynamic language compiler authors must first ask whether optimization has a positive effect on performance. If compilation reduces code execution performance or the runtime overhead of optimization overwhelms its benefits, there is an overall loss. To investigate the potential benefit, we run each of the scenarios described in Section 3.2 for three compiler configurations. One case, default, represents what is shipped with V8/Chromium. sel_off reflects the optimizing compiler turned on but with selected optimizations disabled, and no_opt is a case where the optimizing compiler has been turned off entirely and only full code generation is used.

The effects of optimization are markedly different among the scenarios. Figure 3 illustrates the impact for each of these configurations. As expected and widely disseminated, the V8 optimizing compiler improves performance on the constant-work benchmark considerably (by 51%). On real-world applications, however, benefits are either small or nonexistent. For example, the compiler does produce an improvement for Facebook, where sel_off produces a 3% improvement and the optimizations from Figure 4 add another 4%. However, for WordPress, the net effect of the default compiler configuration is actually negative (a 2% degradation). Additionally, for Gmail, although the net effect of default is slightly positive, it includes optimizations that harm performance relative to the sel_off case. We examine this behavior further in the next section.
4.2 Many optimizations diminish performance


To further examine how toggling optimization affects performance, rather than turning off all optimizations we selectively switch on individual ones. We consider the set of optimizations summarized in Table 1. Here, we use the configuration with optimizing compiler on but the selected optimizations off as the performance baseline, and toggle each optimization separately. Figure 4 considers two cases from the overall results: one where optimizations dramatically improved performance (BenchM) and one where the default optimizations were harmful (Gmail). As above, we run each scenario four times for each configuration.
We make a number of observations. As expected, optimization dramatically improves performance for the V8 benchmark suite (the no_opt time is more than 2x the time of the sel_off case). Likewise, individual optimizations on the whole make small but relatively consistent improvements. However, the complex set of optimizations actually reduces performance for Gmail (the default bar at right), and many individual optimizations are unproductive. In particular, optimizations like global subexpression elimination through gvn that improve benchmark performance are harmful. Additionally, the high compilation overhead for Gmail has no corresponding decrease in JavaScript execution time, and produces the negative difference from sel_off to default. Many traditional compiler optimizations have negligible or negative impact. For example, while gvn and inlining produce benefits for benchmark code they reduce Gmail’s performance. Meanwhile, we observe that range analysis is the only optimization that benefits Gmail — possibly due to the significant simplifications the compiler makes when it knows a numeric type is a small integer [10].
4.3 Reasons for Performance
To gain some understanding of why optimizations might be hurting performance in some circumstances, we compared V8’s internal counters between the no_opt and default cases from Section 4.1 as well as a configuration when the compiler performs optimization on all possible code, always_opt. Table 2 summarizes the counters we found to be interesting. All of the listed counters were already present in V8 aside from the DeoptimizeCount counter, which we added. Our table only includes counters that changed by more than 15% between the default and always_opt cases. The counters reveal some trends as optimization becomes more aggressive.
| Name | Description
|
| V8.DeoptimizeCount | A count of the number of times deoptimization occurs. |
| V8.PcToCode | Incremented when V8 looks up the source code for a particular program counter address. |
| V8.PcToCodeCached | Incrememented when the address V8 is looking up code for is already in the code cache. |
| V8.StackInterrupts | The number of times a stack guard is tripped without an actual stack overflow occurring. |
| V8.TotalCompileSize | The amount of compiled source code in bytes. |
| V8.TotalFullCodegenSourceSize | The amount of source code compiled with the full code generator in bytes. |
| V8.TotalStubsCodeSize | Amount of stub code in bytes. |
Tables 3 and 4 summarize the interesting counters for BenchM and Gmail respectively. In general, the trend is towards more deoptimizations, stack interrupts, and compiled code as optimizations get more aggressive. Ignoring the case where optimizations don’t occur, program counter to source code looks-ups also occur more often and stubs are utilized less often as optimization becomes more aggressive. The trend is towards performing notably more operations in the compiler as the amount of optimization increases. In particular, we measured the impact of increasing deoptimization. By isolating time taken for deoptimization from the profiler results, we find that for always_opt on BenchM the time required to execute deoptimization increases from 0 to 7333 ± 107 profiler ticks as compared to a total of 24726 ± 193 execution ticks — a very significant component of runtime.
| Name | no_opt | default | always_opt
|
| V8.DeoptimizeCount | 0 | 31 | 29425969 |
| V8.PcToCode | 118849 | 69203 | 29818239 |
| V8.PcToCodeCached | 97931 | 47706 | 29796116 |
| V8.StackInterrupts | 1 | 4217 | 26108 |
| V8.TotalCompileSize | 741300 | 890799 | 1107903 |
| V8.TotalFullCodegenSourceSize | 28681431 | 41973361 | 60602864 |
| V8.TotalStubsCodeSize | 34731 | 195279 | 81053 |
| Name | no_opt | default | always_opt
|
| V8.DeoptimizeCount | 0 | 56 | 98783 |
| V8.PcToCode | 410190 | 518182 | 426063 |
| V8.PcToCodeCached | 219940 | 304559 | 232197 |
| V8.StackInterrupts | 1 | 2274 | 3297 |
| V8.TotalCompileSize | 6240862 | 6246345 | 7312290 |
| V8.TotalFullCodegenSourceSize | 946922601 | 961168438 | 1889612635 |
| V8.TotalStubsCodeSize | 58201 | 123055 | 96876 |
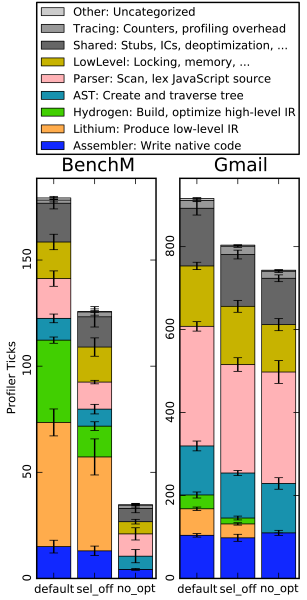
In 4.2 we saw that the compile-time overhead for applications like Gmail is higher than for the V8 benchmark. The question arises of which portions of the compilation process contribute to this overall overhead. We break down compilation time into its multiple phases by analyzing the contents of the profile and attributing a point in the trace to one of nine portions of the codebase. Five of these phases (Assembler, Lithium, Hydrogen, AST, and Parser) correspond to the portions in Figure 1, and three (LowLevel, Shared, and Tracing) are work that is shared between multiple parts of the compiler. Figure 5 illustrates the breakdown for the three summary configurations used previously.
An overall conclusion for Gmail is that much of this compilation time does not come from time spent in the optimizer. Rather, it comes from work that must be done in any case, even with the optimizing compiler turned off entirely. Of all the time allocation, the parser is the largest contributor. Though initially surprising, this is sensible in light of the much larger size of the Gmail source: based on internal counters, the parser handles over 14 times as much code in Gmail than in BenchM. While compilation overhead for BenchM does increase significantly as a result of time spent in the optimization path, the total overhead is small compared to the decrease in JavaScript execution time it produces. These results also support the running observation that the opportunity for optimization is limited in real-world applications.
5 Related Work
Our findings above expand upon studies that indicate JavaScript benchmarks do not represent real-world application behavior. Richards et al look across three popular benchmark suite and find that they use features of dynamic languages much less than real-world applications [22]. The JSMeter project focuses more closely on how behavior differs between benchmarks and real sites using within-browser infrastructure that more closely resembles our own. Its analysis illustrates that popular benchmarks are also not representative on metrics important for compilation like code size, instruction mixes, and hot code [20]. Other efforts examining benchmarks have arrived at the same conclusion, and one in particular provides preliminary evidence that compilation may negatively impact JavaScript performance in some cases [18].
Optimizing compilers for JavaScript would be incomplete without some evaluation of their impact. However, these analyses focus on benchmark suites, primarily the three most popular (SunSpider, V8, and Kraken) [2, 6, 3, 9]. In a promising development, Hackett et al at least consider real-world websites by investigating how they differ from benchmarks, but still only run a performance evaluation on benchmark suites [11]. To our knowledge, no published JavaScript compiler design efforts have included a comprehensive benchmark on real-world applications.
Similar investigations to ours have been performed for other programming languages that make use of JITs. [15] discuss various optimizations used by the Java HotSpot compiler and evaluates their efficacy. Many of the optimizations used by V8, such as on-stack replacement, were first discussed in [12] and were implemented in HotSpot before they were used in V8. Kotzmann et al found that these optimizations were consistently worthwhile for Java code. This investigation parallels our own enough to suggest that Java is better optimized in this way than JavaScript.
6 Conclusion & Discussion
Given the widespread use of JavaScript today and the attention that has been given to maximizing its performance, it is surprising that the real-world effect of optimization has not been more deeply studied. We find that complex optimizations, while beneficial for benchmarks, are of limited usefulness in actual applications. This conclusion merits further work and reconsideration of where dynamic compiler writers spend their effort. Furthermore, these optimizations for dynamic languages are difficult; it is often not easy to demonstrate they are correct due to changing runtime information and the need to deoptimize dynamically [10]. Here we suggest a few directions based on our findings.
If widely-touted improvements in benchmark performance are not improving (or even harming) real-world applications, it is well worth rethinking widely-used metrics of success. Our findings indicate that more representative JavaScript benchmark suites are an important avenue of future research. Recent work on extracting benchmarks from real applications [21] is one promising route.
We observe performance degradation from compilation overhead, but for real-world applications that overhead largely comes from source manipulation rather than optimization. Even though Chromium already lazily transforms source to AST, techniques to limit the amount of code scanned by the browser would be interesting directions. Other ways of offloading just-in-time compilation like running it in parallel on multiple cores are also enticing and need further work to address queueing issues [16].
There seems to be an elusive transition zone where a just-in-time profiler picks good places to optimize, thus improving performance for real applications. A profiler that is not aggressive enough minimizes the usefulness of an optimizer, but a profiler that is too aggressive causes serious performance degradation. Finding a superior point along this spectrum for real-world applications is a key step moving forward.
It is important for compilers to focus their optimization efforts on changes that yield performance improvements. Likewise, it is important that compiler research efforts emphasize improvements that benefit real applications. We neither believe nor hope that this work serves as an authoritative compiler benchmark; instead, we hope its insights help inform efforts like those above.
A Lessons Learned
Real-world applications present a number of challenges when running benchmarks. First, simply reproducing realistic interactions is nontrivial: automated tests need to take actions like identifying portions of the user interface to click, when to move on to another task, and do so reliably. More fundamentally, real-world websites like Gmail change their source code on a regular basis. In this work we were able to control this problem for WordPress and Trac by installing a fixed version, but clearly no local installation of Gmail or Facebook exists. We had to take care to run tests within a short period of time, and often had to re-run tests to ensure they used comparable code.
Though by no means a new insight, we have (re)learned the lesson that modifying large production codebases is difficult. The first step of discovering where to make modifications is significant in and of itself. Ensuring our instrumentation worked properly and understanding its output was also far from simple.
B Distribution of Credit
Credit should be distributed equally (50%-50%) between the two authors of this paper.
References
[1] Alexa. Top Sites. http://www.alexa.com/topsites.
[2] M. Chang, B. Mathiske, E. Smith, A. Chaudhuri, A. Gal, M. Bebenita, C. Wimmer, and M. Franz. The impact of optional type information on jit compilation of dynamically typed languages. In DLS, pages 13–24, New York, NY, USA, 2011. ACM.
[3] M. Chang, E. Smith, R. Reitmaier, M. Bebenita, A. Gal, C. Wimmer, B. Eich, and M. Franz. Tracing for web 3.0: trace compilation for the next generation web applications. In VEE, pages 71–80, New York, NY, USA, 2009. ACM.
[4] T.-H. Chang, T. Yeh, and R. C. Miller. GUI testing using computer vision. In CHI, pages 1535–1544, New York, NY, USA, 2010. ACM.
[5] A. Charland. Mobile application development: web vs. native. Communications of the ACM, 54(5):49–53, 2011.
[6] M. Chevalier-Boisvert, E. Lavoie, M. Feeley, and B. Dufour. Bootstrapping a self-hosted research virtual machine for JavaScript: an experience report. In DLS, pages 61–72, New York, NY, USA, 2011. ACM.
[7] R. Dahl. Node.js: Evented I/O for V8 JavaScript. http://nodejs.org.
[8] ECMA International. Standard ECMA-262: ECMAScript Language Specification, 3rd edition. Technical report, 1999.
[9] A. Gal, B. Eich, M. Shaver, D. Anderson, D. Mandelin, M. R. Haghighat, B. Kaplan, G. Hoare, B. Zbarsky, J. Orendorff, J. Ruderman, E. W. Smith, R. Reitmaier, M. Bebenita, M. Chang, and M. Franz. Trace-based just-in-time type specialization for dynamic languages. In PLDI, pages 465–478, New York, NY, USA, 2009. ACM.
[10] Google Inc. V8 - Project Hosting on Google Code. http://code.google.com/p/v8/.
[11] B. Hackett and S.-y. Guo. Fast and Precise Hybrid Type Inference for JavaScript. In PLDI, Beijing, China, 2012. ACM.
[12] U. Hölzle. Adaptive Optimization For Self: Reconciling High Performance With Exploratory Programming. PhD thesis, 1994.
[13] HP. Developing JavaScript Services. https://developer.palm.com/content/api/dev-guide/js-services/overview.html.
[14] D. Jang and K.-M. Choe. Points-to analysis for JavaScript. In SAC, pages 1930–1937, New York, NY, USA, 2009. ACM.
[15] T. Kotzmann, C. Wimmer, H. Mössenböck, T. Rodriguez, K. Russell, and D. Cox. Design of the Java HotSpot client compiler for Java 6. ACM Trans. Archit. Code Optim., 5(1):7:1—-7:32, May 2008.
[16] P. A. Kulkarni. JIT compilation policy for modern machines. In OOPSLA, pages 773–788, New York, NY, USA, 2011. ACM.
[17] J. Martinsen. A methodology for evaluating JavaScript execution behavior in interactive web applications. In AICCSA, pages 241–248, Sharm El-Sheikh, Egypt, 2011.
[18] J. K. Martinsen, H. Grahn, and A. Isberg. Evaluating four aspects of JavaScript execution behavior in benchmarks and web applications. In ICWE, pages 399–402, Paphos, Cyprus, 2011. Springer.
[19] Microsoft. Roadmap for Metro style apps using JavaScript. http://msdn.microsoft.com/library/windows/apps/hh465037.
[20] P. Ratanaworabhan, B. Livshits, and B. G. Zorn. JSMeter: Measuring JavaScript Behavior in the Wild. In WEBAPPS, Boston, MA, USA, 2010.
[21] G. Richards, A. Gal, B. Eich, and J. Vitek. Automated construction of JavaScript benchmarks. In OOPSLA, pages 677–694, Portland, OR, USA, 2011. ACM.
[22] G. Richards, S. Lebresne, B. Burg, and J. Vitek. An analysis of the dynamic behavior of JavaScript programs. In PLDI, pages 1–12, New York, NY, USA, 2010. ACM.
[23] StatCounter. GlobalStats Top 5 Browsers. http://gs.statcounter.com/#browser-ww-monthly-201103-201203, 2012.