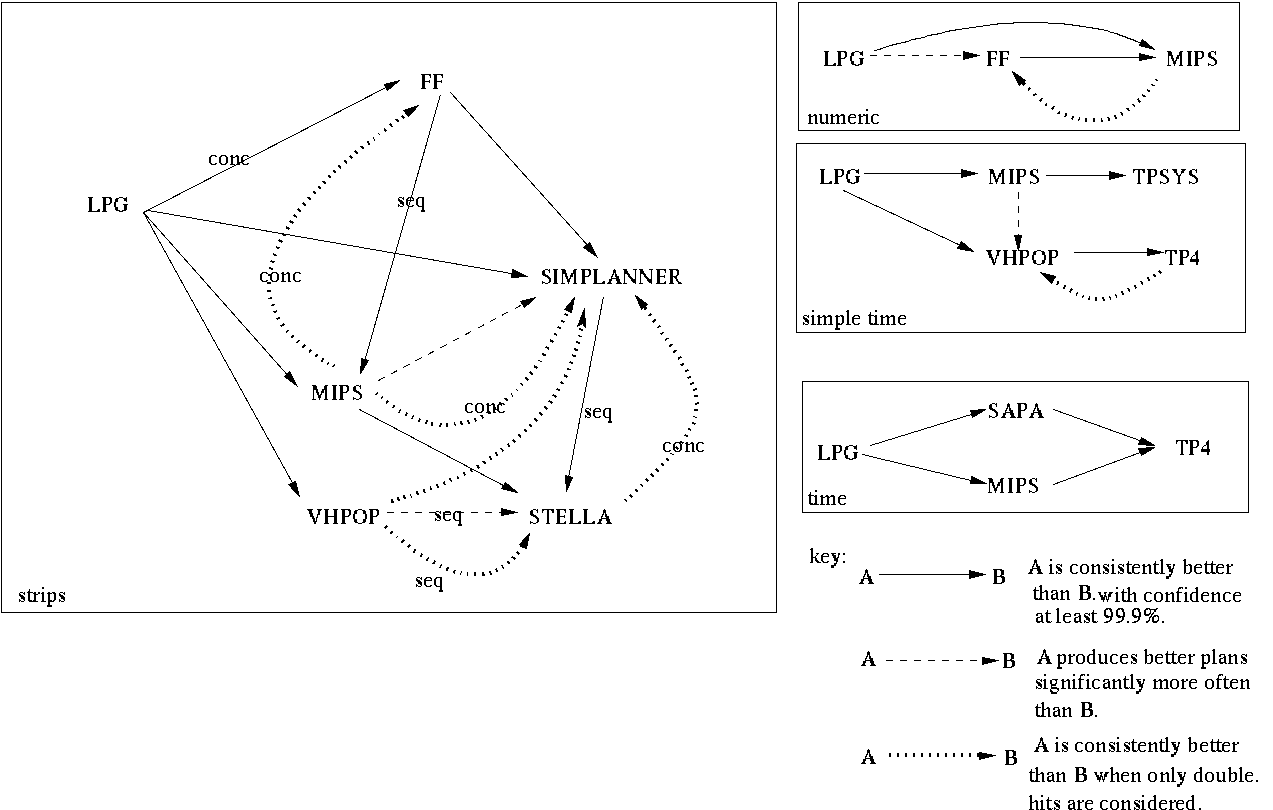
As indicated above, comparison of quality performance is made difficult if one of the two planners being compared solved many more problems than the other (this problem only arises for the fully-automated planners because the hand-coded planners failed to solve so few problems that the proportion of unsolved problems did not affect our tests). Using an infinite quality measure for unsolved problems the Wilcoxon test concludes that the planner solving the most problems has overall better quality -- in other words, if one is interested in overall solution quality one should choose the planner that solves the most problems even if, in some cases, it produces worse quality plans than its competitor. However, we also want to understand the relationship between the two planners in the double hits case. We notice that consideration of just these problems sometimes inverts the relationship detected by the first test. For example, in Figure 11 it can be observed that, at the SIMPLETIME level, VHPOP consistently produced better quality plans than TP4 across the whole problem set but, when only double hits are considered, TP4 produced consistently better plans than VHPOP. This suggests that TP4 is solving problems with higher quality solutions, but that the price it pays in search to find these solutions is so high that it solves a much smaller set of problems than other planners, such as VHPOP. We depict these results using dotted arrows in the graphs. Finally, it can arise that the Wilcoxon test detects no significant relationship between two planners, but that the difference in the proportion of problems solved by the two planners is significant. We indicate the resulting weaker relationship using a dashed arrow.
Figure 11 shows that LPG emerges as the fully-automated planner consistently producing the highest quality plans at all problem levels. The relationship between FF and MIPS is more complex because, whilst FF produced plans of better sequential quality than MIPS, MIPS produced better quality concurrent plans than FF when considering only double hits. The reason for this apparent discrepancy is that MIPS post-processes sequential plans into partially ordered plans exploiting some of the available concurrency in the problem, which FF does not exploit. However, it fails to solve a larger subset of problems than FF, giving FF the advantage in quality overall.
In the STRIPS problems SIMPLANNER solves more problems than STELLA and hence is seen to be performing at a consistently higher sequential-plan quality level. When double hits are considered STELLA outperforms SIMPLANNER in concurrent-plan quality. Also, when double hits are considered, it can be seen that VHPOP consistently outperforms STELLA for sequential-plan quality and SIMPLANNER in all cases. Interestingly, VHPOP and STELLA have no Wilcoxon or proportion test relationship when all problems are considered.
MIPS outperforms VHPOP and TPSYS in the SIMPLETIME problems, with VHPOP consistently better than TP4. When only double hits are considered TP4 outperforms VHPOP demonstrating that TP4 produces better quality solutions for those problems that it solves. Given the available data it seems that TP4 and TPSYS are not performing significantly differently, but it may be that the data set is too small to draw this conclusion with confidence.
In the TIME data set there is no significant consistent pattern in the relative performances of SAPA and MIPS. LPG consistently produces better quality plans.
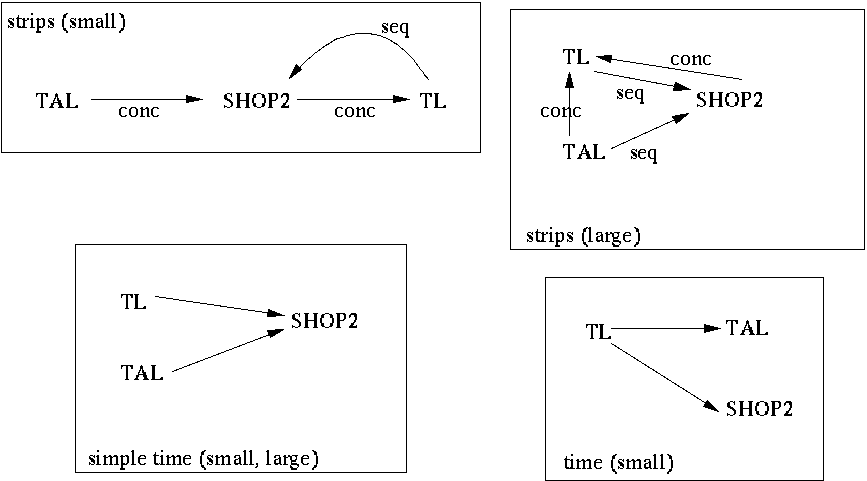
As with the fully-automated planners we find that the speed comparisons that can be observed do not hold when the planners are compared in terms of quality. Figure 12 shows the quality comparisons we performed on the three competing hand-coded planners. It shows that, in the small STRIPS problems TLPLAN consistently outperformed SHOP2 in terms of sequential plan quality. In the small problems TALPLANNER produces shorter makespan plans than both TLPLAN and SHOP2 and SHOP2 produces shorter makespan plans than TLPLAN. TLPLAN produces sequential STRIPS plans and does not use any post-processing step to introduce parallelism. As a result it is certain to be outperformed in a makespan comparison with planners capable of producing parallel plans.
No significant relationships emerged in the NUMERIC problems. TALPLANNER did not compete in the NUMERIC problems. No significant Wilcoxon result was established.
In the SIMPLETIME problems (both small and large) the quality performances of TLPLAN and TALPLANNER are indistinguishable, and both are consistently better than SHOP2. In the TIME problems TLPLAN emerges as consistently better than TALPLANNER and SHOP2.