* Some of the TC experimental results
2. A link to the structure graph of Reuters 2001 collection
3. Results on TREC10 data (84 topic categories)
7. Results on Updated
R2001(Topic code) data(781265 test documents)
Result summarize
| RCV1(topic code) | RCV1(industry code) | RCV1(region code) | ||||||||||
| 783484 test set | 781265 test set | 783484 test set | 781265 test set | 783484 test set | 781265 test set | |||||||
| Micro avg. F1 | Macro avg. F1 | Micro avg. F1 | Macro avg. F1 | Micro avg. F1 | Macro avg. F1 | Micro avg. F1 | Macro avg. F1 | Micro avg. F1 | Macro avg. F1 | Micro avg. F1 | Macro avg. F1 | |
| kNN |
0.7666
|
0.5374
|
0.7673
|
0.5379
|
0.3952
|
0.2103
|
0.3955
|
0.2106
|
0.7909
|
0.4531
|
0.7908
|
0.4531
|
| Rocchio |
0.6950
|
0.4994
|
0.6957
|
0.4998
|
0.3838
|
0.1523
|
0.3842
|
0.1525
|
0.7929
|
0.4405
|
0.7932
|
0.4406
|
| NB(multi-class) |
0.6700
|
0.4606
|
0.6714
|
0.4619
|
0.3114
|
0.0719
|
0.3118
|
0.0720
|
0.7544
|
0.3682
|
0.7549
|
0.3684
|
| SVM |
0.8096
|
0.6032
|
0.8104
|
0.6036
|
0.5121
|
0.2659
|
0.5122
|
0.2660
|
0.8726
|
0.4632
|
0.8726
|
0.4632
|
| Micro avg F1 | Macro avg F1 | |
| KNN | 0.765 | 0.549 |
| Rocchio | 0.693 | 0.495 |
| NB(multi_class) | 0.625 | 0.470 |
| NB(binary version) | 0.666 | 0.437 |
| SVM1 | 0.816 | 0.607 |
| SVM2 | 0.810 | 0.546 |
| SVM2 with SVM1's thresholds | 0.791 | 0.594 |
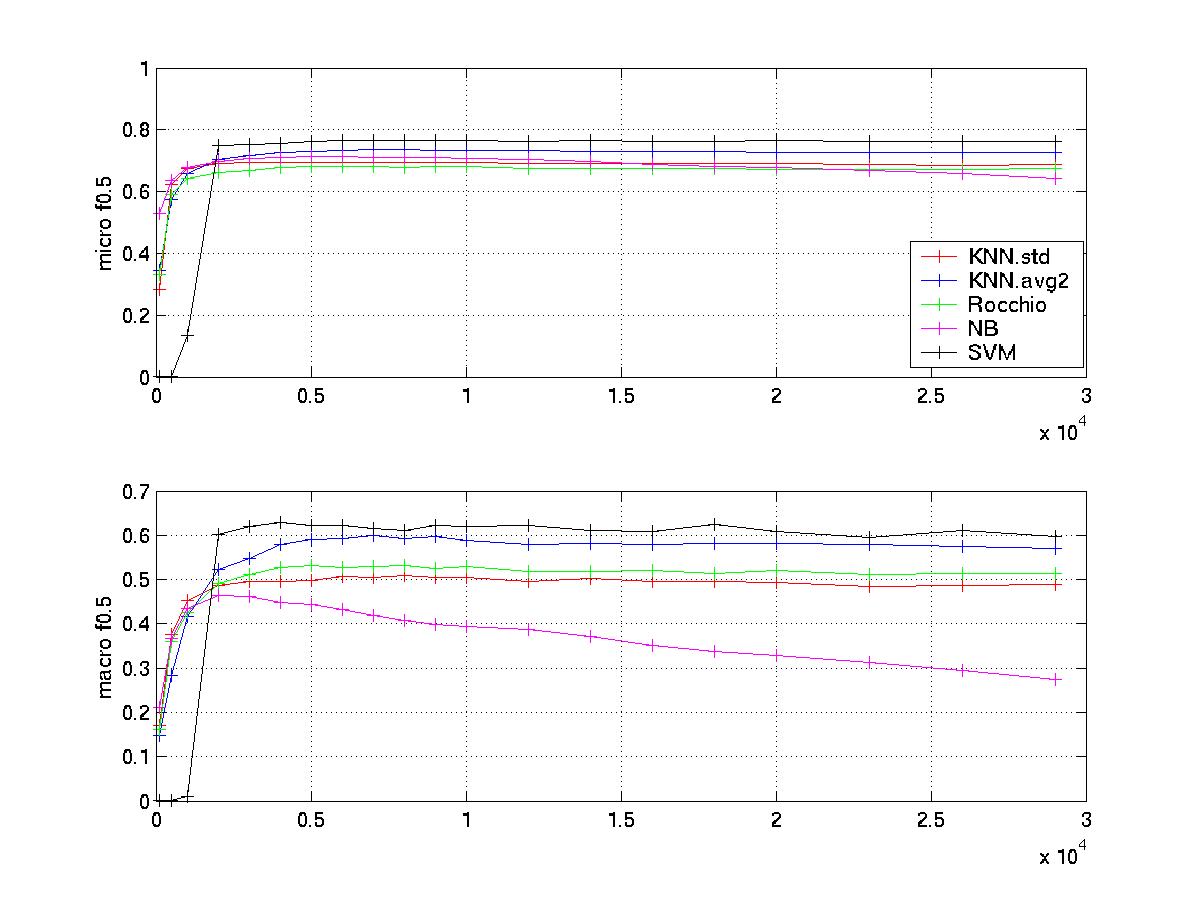
Some graphic Performance analysis
A feature selection graph,which
shows the different sensitivity to feature number of different classifiers
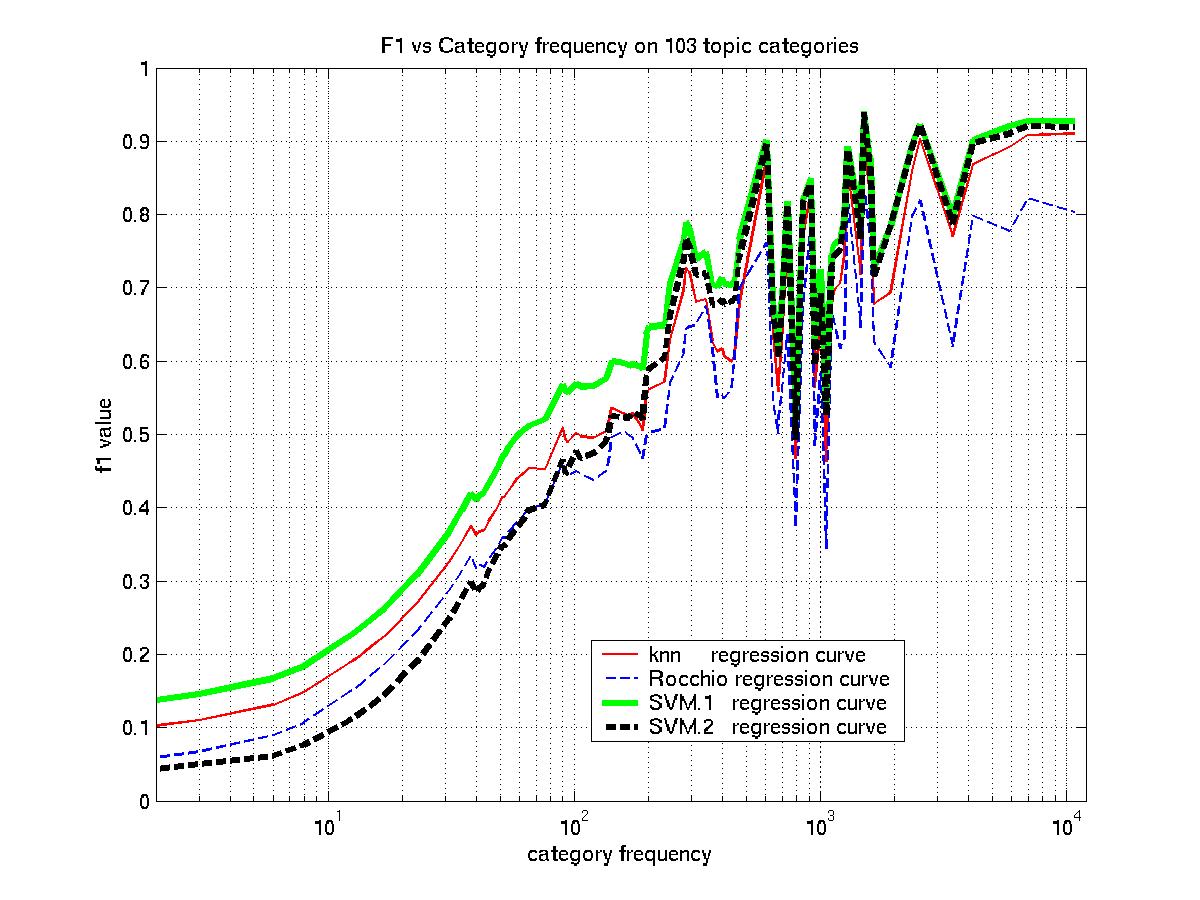
A catfre VS F1 graph on the
updated R2001(topic) data set ,which shows the catfre-f1 curve of different
classifiers
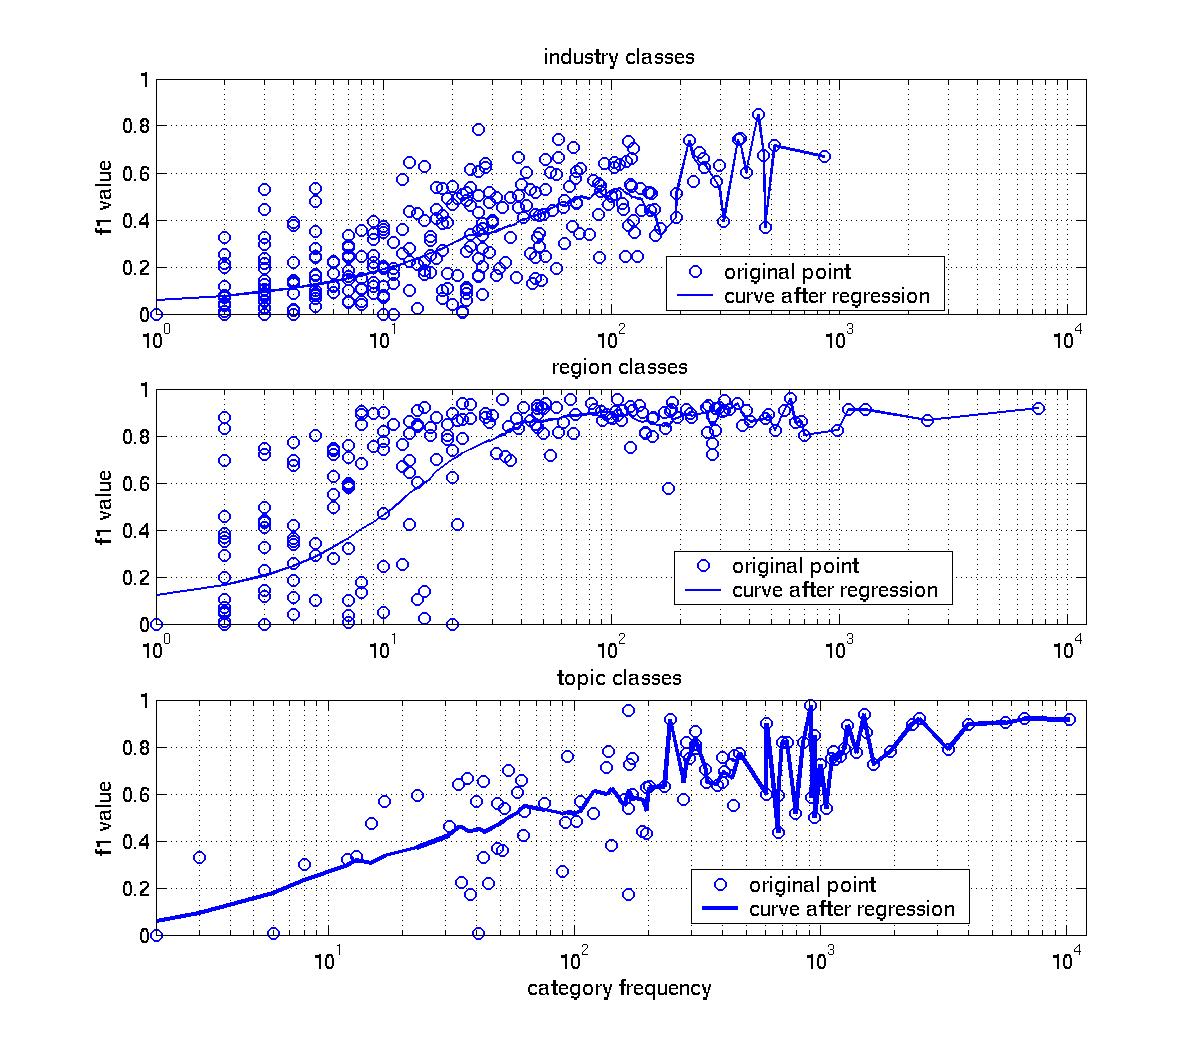
A SVM classifier catfre VS F1
graph on the 3 schemes of R2001 ,the most interesting phenomenome
is the saturation on industry category.
Time cost analysis
In time complexity analysis, let S=number of training documents, V=number
of words, C=number of possible classes, L=average length of a document
.L'=average number of features in a document, k=the length of decision
tree. So the average document frequency in a inverse index is L'*S/V, The
time complexity of flat classifier is like following:
| Training cost | Testing cost | |
|---|---|---|
|
Rocchio
|
O(LS)+O(CV)
|
O(L'C)
|
|
NB(multi-class version)
|
O(LS)
|
O(LC)
|
|
KNN
|
O(LS)
|
O(L'LS/V)+O(Slog(S))
|
|
SVM
|
the key component of SVM's training time
is the quadratic optimization time. When training documents>10000, It can
be a bottleneck. According to [Thorsten] SVM's training time is roughly
comparable to C4.5
|
The test cost can be written as O(xCL'LS/V).
,and more expensive than NB,Rocchio and KNN. SVM's test speed are faster
than KNN.
|
|
C4.5
|
O(kscv)
|
Here is a table about the time these classifiers used when running on
R21578(90 categories) (parameter tuning time is not included)
| Training cost | Testing cost | Total cost | |
|---|---|---|---|
|
Rocchio (all features used)
|
Totally 2010.49 CPU seconds.
|
||
|
KNN(k=10) (all features used)
|
Totally 124.15 CPU seconds, mostly spent
in test phrase
|
||
|
NB (multi-class version) (all features
used)
|
6.31 CPU seconds
|
11.68 CPU seconds
|
27.68 CPU seconds
|
|
NB(binary version) (all features used)
|
371.8 CPU seconds
|
159.66 CPU seconds
|
964.58 CPU seconds
|
|
SVM (all features used)
|
432.04 CPU seconds
|
127.03 CPU seconds
|
658.36 CPU seconds
|
Here is a table about the time these classifiers used when running on
RCV1(industry area) (313 categories in training set)
| Training cost | Testing cost | Total cost | |
|---|---|---|---|
|
Rocchio (10000 top features used)
|
Totally 36160.52 CPU seconds.
|
||
|
KNN (10000 top features used)
|
Totally 67369.38 CPU seconds, mostly spent
in test phrase
|
||
|
NB (multi-class version) (10000 features
used)
|
8.9 CPU seconds
|
3937 CPU seconds
|
29161 CPU seconds
|
|
NB(binary version)
|
CPU seconds
|
CPU seconds
|
CPU seconds
|
|
SVM (all features used)
|
CPU seconds
|
CPU seconds
|
CPU seconds
|