RESEARCH
SAMPLES
SAGE
PAPERS
PEOPLE
HOME

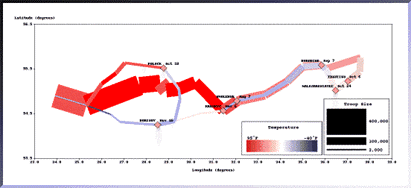
(Figure generated by SAGE.)
This picture, generated with the SAGE system, uses most of the same techniques as the original by Minard. The
flexibility of SAGE's graphic design environment enabled the use of color to express temperature during marches
between cities, emphasizing the relation between quantities and locations more directly.
The use of color clearly shows the heat wave during the advance and the steady decline in temperature through the
retreat. The exception, a spell of temperatures above freezing, is clearly visible when the retreating army is between the
cities of Krasnyj and Bobr.
Go to next page.

