
Figure 1: All houses, color coded by neighborhood.
Proceedings of the ACM Symposium on User Interface Software and Technology (UIST '97), ACM Press, October 1997, pp 189-198.
ABSTRACT
Direct manipulation of visualizations is a powerful technique for performing exploratory data operations such as navigation, aggregation, and filtering. Its immediacy facilitates rapid, incremental, and reversible forays into the data. However it does not provide for reuse or modification of exploration sessions. This paper describes a visual query language, VQE, that adds these capabilities to a direct manipulation exploration environment called Visage. Queries and visualizations are dynamically linked: operations on either one immediately update the other, in contrast to the feedforward sequence of database query followed by visualization of results common in traditional systems.
These features are supported by the architectural concept of threads, which represent a sequence of navigation steps on particular objects. Because they are tied to particular data objects, they can be directly manipulated. Because they represent operations, they can be generalized into queries. We expect this technique to apply to direct manipulation interfaces to any object-oriented system that represents both objects and the relationships among them.
Proceedings of the ACM Symposium on
User Interface Software and Technology (UIST '97), ACM Press, October
1997, to appear.
Copyright 1997 ACM.
1. THE MULTIPLE OBJECT PROBLEM
We are concerned with data visualization
systems that produce "business graphics" consisting of charts, maps, network
diagrams, as well as more sophisticated and special purpose graphics showing
abstract data. It is often natural to provide the user with an object-oriented
data model to accompany these visualizations. For instance in
Figure 1, each point on the map represents
a single house. Each house has attributes like neighborhood, latitude,
and number_of_rooms.
Figure 1: All houses, color coded by neighborhood.
Many data exploration tasks involve the relationship among multiple objects. For instance, the database schema shown in Figure 2(top) has separate objects for houses, schools, companies, people, and sales. The schema also includes the attributes for each object type, and the relationships among objects. For example, companies have a name, total_sales, and an incorporation_date. They can be the builders of houses. Persons can fill any of four roles in a sale: seller_agent, buyer_agent, buyer, or seller.
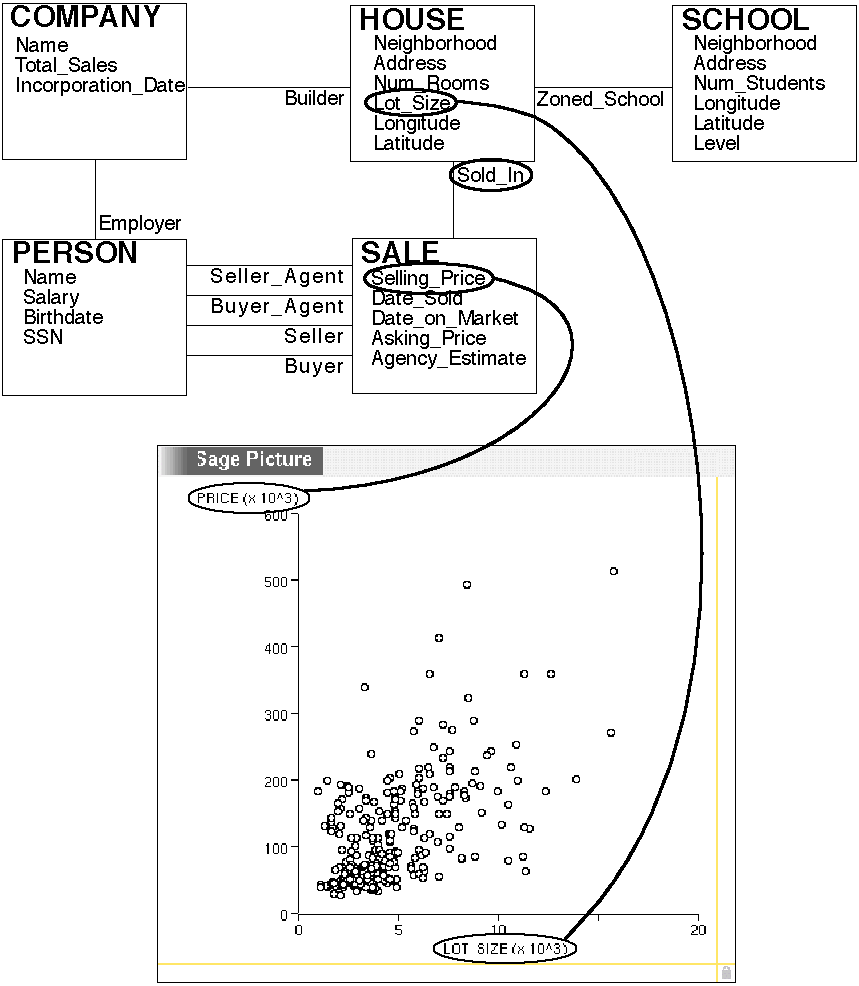
Figure 2: Top: the database schema. Bottom: chart comparing attributes
from two different object types. All <house, sale> pairs related
by the sold_in relationship generate a point on the chart.
Databases containing multiple objects like these increase the complexity of information exploration processes. In particular, there are three areas of complexity that we have identified and attempted to address in the Visage/VQE environment.
1.1 Visage
Visage is an information centric [10,11] user interface environment for data exploration and for creating interfaces to data-intensive applications. Data objects are represented as first class interface objects that can be manipulated using a common set of basic operations, such as drill-down and roll-up, drag-and-drop, copy, and dynamic scaling. These operations are universally applicable across the environment, whether graphical objects appear in a hierarchical table, a map, a slide show, a query, or other application user interface. Furthermore, graphical objects can be dragged across application UI boundaries. Integrating the visualization system directly with an underlying database, rather than just deriving visualizations from otherwise isolated tables, is key to coordinating visualization applications with the other components of an exploratory data analysis environment.
Visage includes ubiquitous extensional query operations. A user can navigate from the visual representation of any database object to other related objects. For instance, from a graphical object representing a real estate sales agent, one can navigate to all the houses listed by that agent. It is also possible to aggregate database objects into a new object, which will have attributes derived from its elements. For instance, we could aggregate the houses listed by John and look up their average size or recompose this set into sub-aggregates based on neighborhood or number of rooms (i.e. all Shadyside houses listed by John with 8 rooms).
We can brush [3] graphical objects in a visualization to change their color, and have graphical objects in all visualizations representing the same data object also be colored. This kind of coordination enables the user to see correlations among more variables than can be encoded in a single visualization.
We can filter objects based on any numerical attribute with a Dynamic Query slider [1]. Graphical objects representing a data object whose attribute value falls outside the range selected by the slider are made invisible.
The three direct manipulation operations, brushing, filtering, and drag and drop, are normally implemented under the assumption that there is a many-to-one mapping between graphical objects and data objects. If graphical objects in multiple visualizations refer to the same data objects, these operations will affect all the visualizations in the same way, in which case they are said to be coordinated. Becker and Cleveland [3] originally conceived this architectural approach to coordination, and it represented a significant advance over earlier visualizations using ad hoc data structures. However their elegantly simple notion breaks down in the face of a database with multiple object types.
In previous data exploration systems using relational databases, the database contains a table of houses and a table of sales. Figure 1 was generated entirely from the house table, so its graphical objects are mapped to records in that table. To graph selling_price versus lot_size in Figure 2, we must form a relational join between the two tables, generating a third table whose attributes include both selling_price and lot_size. Graphical objects in the chart map to records in the new table. Therefore the two visualizations cannot be coordinated under Beckers architecture. Further, records in a relational database table have no structure beyond its set of attributes. They contain no memory of what tables they were generated from. So even with a more complicated coordination architecture, there is just not enough information in table records to do coordination based on object identity.
Visage solves this problem within the information-centric paradigm by mapping graphical objects to graph structures of objects, which are called threads. Because threads remember the objects from which they are constructed, coordination across visualizations with related but distinct thread structures is possible (see section 4). Threads provide an architectural solution to the multiple-object problem, but not a UI solution. There is still the need for queries to specify how threads are constructed, as well as other dataset definition operations.
1.2 VQE
VQE is a visual query environment within Visage for representing operations explicitly. It enables an analyst to construct complex intentional queries during data exploration and reuse them later. VQE queries can express navigation across relationships, aggregation, and filtering by range selection or by arithmetic or equality relations between attributes.
In traditional relational database query languages, queries are applied to tables in databases, generating new tables. As we have seen, the problem with this is that tables are at the wrong level of granularity. In order to link visualizations from multiple queries, visual objects should represent meaningful objects such as houses, rather than records from arbitrary tables. Therefore in VQE queries are applied to threads in databases, generating new threads. Since VQE is based on threads, queries are fully integrated with the rest of Visage: not only can query results be dragged to other visualizations, but objects from visualizations can be dragged into queries (i.e. be the input to query expressions). User directed changes to queries and visualizations are immediately reflected in each other.
In summary:
2. EXAMPLE
Visualization and querying, both extensional and intentional, are illustrated on a fictitious database that might have been collected by a group of real-estate agents describing clients and sales information for three neighborhoods for 1989. The database schema is shown in Figure 2. The agent has a client who would prefer to live in Point Breeze, but is willing to consider Squirrel Hill since the average price of houses there is lower. The agent plans to explore whether the mere fact of the neighborhood label has an effect on price. Pittsburgh is famous for the character of its neighborhoods, and boundaries between them are labeled on street signs. However there are no major barriers separating these neighborhoods, and the character of the houses does not change abruptly. If houses just over the border in Squirrel Hill are less expensive, the client may be better off buying there.
2.1 Intentional Object Sets
The agent would like to see a map like
1 that also encodes price. Unfortunately,
price is not an attribute of houses, so a query is required. In Figure
1, the user has selected some houses that straddle the border with a bounding
box. He copy-drags this set to VQE in order to begin query construction
(Figure 3). The set of houses is visualized as a dynamic aggregate.
It is an aggregate because operations on it apply to each of its 27 elements;
it is dynamic because it represents an intentional set. As the user changes
the query, the set of houses that satisfy it (its extension) changes. Even
if the query doesnt change, it may be applied to a different set of houses
simply by dragging objects into or out of dynamic aggregates.

Figure 3: The selected houses have been dragged to the QueryEnvironment
frame (VQE), where they become a dynamic aggregate. The arrows to
the right constitute a menu for parallel navigation.
2.2 Intentional Navigation
The agent first wants to link the houses with their sales, so has brought up a menu of relationships that houses participate in. He will select the sold_in relationship and drag its arrowhead to a screen location where a second dynamic aggregate will be placed (see Figure 4, top). We call this operation parallel navigation, because we are navigating across the sold_in relationship for each element of the aggregate. The new dynamic aggregate will be the aggregate of all the sales of these houses. Parallel navigation corresponds to a join in a relational query, or a path expression in an object-oriented query. If objects are added to or removed from a dynamic aggregate, the intentional navigation representation allows other linked dynamic aggregates to update, maintaining query consistency.

Figure 4: Middle: A SageBrush sketch calling for a map with points
inside it. Attributes from the dynamic aggregates have been mapped
to graphical properties of the point. Bottom: The resulting
visualization.
2.3 Creating Visualizations
Now that the houses and sales have been linked, the agent can specify how to encode attributes from both types of objects within the same visualization. He constructs a SageBrush sketch (Figure 4, middle) for a map just like Figure 1, except that it will encode selling price by the size of the points. Figure 4 (bottom) shows the result. Each visual object on the map now represents a <house, sale> thread, but coordination still happens via the thread objects.
The new map does little to confirm the neighborhood label hypothesis: the variance in point size overwhelms any systematic difference, which if anything favors Squirrel Hill with the expensive houses.
2.4 Defining New Attributes
A second question is whether the client will be able to qualify for a higher mortgage in one neighborhood than another. Although this information cant be predicted with certainty, an indicator is the ratio of selling_price to buyer salary for other sales in the two neighborhoods. This ratio is not defined for any of the object types in the database, and so the only recourse in previous visualization systems would be another session with the database to generate another table. VQE provides a spreadsheet-like interface for this purpose. First the agent performs another parallel navigation from sale across the buyer relationship to person, in order to access the salary attribute. Figure 5 illustrates the definition of StretchRatio as selling_price/sum(buyer® salary). That is, for each sale a new attribute value is computed by navigating to all the buyers in the sale, adding up their salaries, and dividing into the selling price. The new attribute is a permanent addition to the database schema, and may be used in queries that dont involve a person dynamic aggregate.
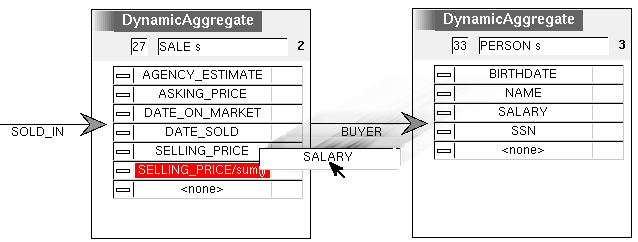
Figure 5: Defining the new attribute to be called StretchRatio.
Figure 6 shows a new map where size encodes StretchRatio rather than selling_price. As a memory aid, the agent has edited the title of the visualizations to "SellingPrice" and "StretchRatio." The variance has been reduced, and a systematic tendency to buy a more expensive house for a given salary level is apparent. The clients original preference for Point Breeze is well supported. There is no indication that she will pay more for the same quality house, and she may be able to borrow more and therefore afford a nicer house.
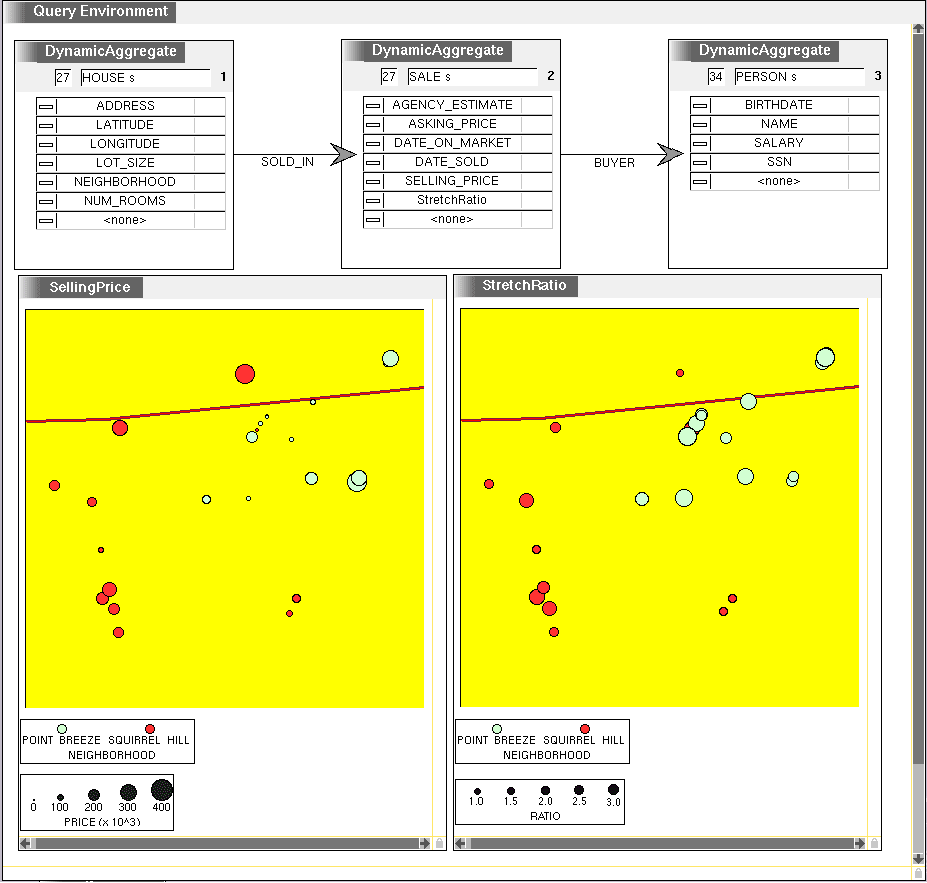
Figure 6: The new visualization (lower right) shows the StretchRatio
of the border houses.
2.5 Extensional Query Update
Having found an interesting relationship between Squirrel Hill and Point Breeze, the agent wonders whether it applies to Squirrel Hill and Shadyside. The exploration sequence can be reused simply by dragging more objects into the visualization. Using another bounding box on the map of Figure 1, the agent picks out houses near the border between Squirrel Hill and Shadyside, and copy drags them to one of the maps inside VQE. Recall that points on the original map represented houses, while those on the second map represent <house, sale> threads, and those on the third represent <house, sale, person> threads. When the drop occurs, Visage consults the thread representation to perform the appropriate navigation operations necessary to convert from one thread structure to another (see section 4). In this way, the appropriate objects are added to the two visualizations and the three dynamic aggregates (Figure 7).

Figure 7: Adding houses on the border between Squirrel Hill and Shadyside.
VQE queries have both intentional and extensional aspects. The graph structure and slider settings form the intention, which is dynamically applied to any objects extensionally dragged in or out of any dynamic aggregate or visualization.
2.6 Saving the Query
Just as easily as new objects were added to the query, the old objects can be removed, leaving a bare query that can be named and saved for reuse in a later session. We intend to extend the SageBook [5] interface to enable searching for queries based on characteristics of the visualizations or the query.
2.7 Different Input to the Query
Later, the agent has been exploring pricing strategies. Is it better to ask a high price and be willing to negotiate more, or to offer the lowest price up front? In Figure 8, the agent has defined two new attributes: Days_on_Market = date_sold - date_on_market is displayed on the x-axis; %_Price_Drop = 100*(1 - selling_price/asking_price) is displayed on the y-axis. Interestingly, there is little correlation. Some houses even sell for more than the asking price, including one outlier that increases almost 60%! This last is probably a data entry error.
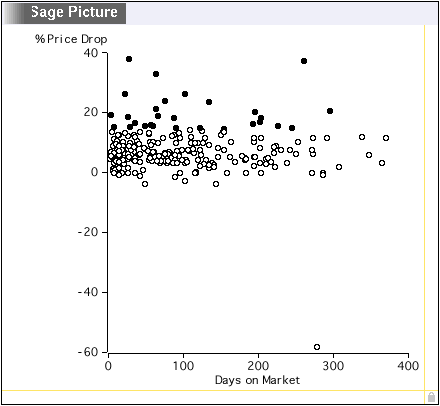
Figure 8: Percentage drop from asking_price to selling_price is plotted
against the number of days on the market. Sales with a large drop
in price have been brushed with black paint.
Out of curiosity, he wonders whether %_Price_Drop has any impact on the StretchRatio location dependence found earlier. He finds and restores the earlier exploration session, and copy drags all the points from the chart onto the sale dynamic aggregate (Figure 9). VQE navigates to the appropriate houses and buyers, and populates the two maps. Note that the navigation is now being done in a different direction, because we are starting with sales rather than houses. This is possible because the query is a declarative specification of constraints among objects, rather than a procedure as might be captured by a programming-by-demonstration macro facility.
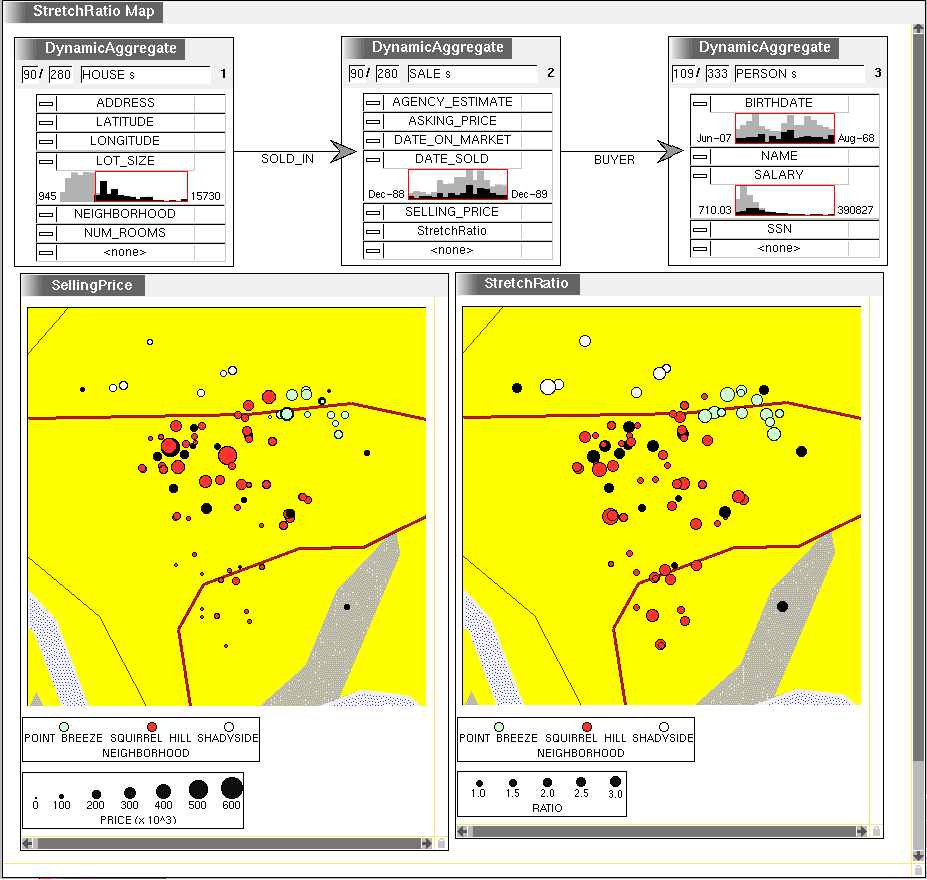
Figure 9: Reusing the analysis on sales from Figure 8. Brushing
is coordinated. Dynamic Query sliders have been added.
2.8 Brushing and Filtering
Figure 9 also shows several further exploration operations. First, the agent has brushed the highest price drops in the chart with black paint, causing the corresponding houses to be painted black on the maps. He has also dropped dynamic query sliders on several of the attributes. These sliders include histograms showing the distribution of values for the attribute. The rectangular outlines show the currently selected range for each slider. Only the range of the lot_size slider has been restricted, to filter out houses with small lots. The histograms are updated to show the distribution of filtered values in black, while the original distribution remains in gray.
3. Usefulness of threads
Direct manipulation interfaces are easy to learn and use at least in part because they map interface objects onto the users intuitive object-oriented domain model. For applications where relationships among multiple objects are important, previous architectures for direct manipulation do not apply. We are unaware of any previous use of composite first class objects like threads, which enable the interface to transparently respect object identity while manipulating attributes of distinct but related objects.
Even within the object-oriented database community, there is no mention of first class objects that refer to structures of domain-level objects. Object-oriented databases include path expressions [13] for describing navigation operations, but they depend on a host programming language to extract attributes of related objects. OQL query semantics are defined in terms of extensional patterns [2], which are like threads, but are merely theoretical pedagogical concepts.
Not providing threads as first class objects is most likely for efficiency reasons. Since tuples of objects can be reconstructed at will, what is the point of maintaining them in persistent store rather than ephemerally in the host languages variable bindings or other data structures?
We argue that the overhead is justified by the increased architectural modularity afforded the interface. As GUIs become ever more complex, there is a trend to make them application-independent utilities. Visage takes advantage of this separation in order to present multiple applications to the user as one, with transparent coordination and communication between them, and consistent behavior across them. This separation requires that all data be stored in a consistent form in a shared database, however. Anything required by the interface must be in this persistent store.
4. implementation
Visage is implemented on top of the Saga GUI toolkit from Maya Design Group, which runs on Macintosh, IBM PC, and Unix/X. VQE is implemented on top of Visage, using Sagas scripting language. Below are brief descriptions of algorithms for extending direct manipulation operations to deal with threads.
Brushing. When a graphical object is brushed, a message is sent to all visualizations to color corresponding objects with the current brushing color. This is just as in any brushing algorithm. The hitch is that in VQE we want brushing to be coordinated across visualizations generated from multiple queries, which may have different thread structures. So we send a separate message for each object of the thread. A visualization colors a thread if any of its objects match the argument of the message.
For instance, when the high-drop sales are brushed in Figure 8, and the visualizations in Figure 9 are given the message, they both find graphical objects to color, because their threads contain sale objects. On the other hand, the map in Figure 1 does not color any of its graphical objects, which mention only houses. In contrast, if the user had painted objects in the SellingPrice visualization in Figure 9, messages would have been sent to color houses, and more messages would have been sent to color sales. Therefore objects in Figure 1 (as well as in Figures 8 and 9) would have been colored.
Dynamic Query. Each query graph maintains a list of threads that constitute the current dataset to which the query is applied. For each thread it remembers how many DQ sliders are currently filtering out the thread. Each DQ slider is associated with a node in the query graph and an attribute. Its job is to tell the query when it filters out or reinstates a thread.
When it receives the message, the query increments or decrements the counter associated with the thread. If the count decreases to zero or increases from zero, the visibility of all objects representing the thread must be changed and the histograms of all sliders must be updated. So far, the algorithm is identical to DQ algorithms for ordinary objects. Again we deal with the difference between threads and ordinary objects by issuing a separate visibility message for each thread object.
Updating histograms is more complicated than in the non-thread case, because they record the frequency of objects rather than threads. An object is considered to be filtered out iff all threads containing it are filtered out. Therefore each query node must maintain a count of the number of threads filtered out for each object. When this number crosses a threshold, the histogram is updated just as in the ordinary case [14].
Drag and Drop. Rather than storing the graph structure on every thread, it is stored as a separate template, and all threads with the same structure point to the same template. The template records the object type of each node, and the relationships between pairs of nodes. Every Sage visualization is designed to display threads with a particular template. When dropping a graphical object into a visualization, Visage tries to coerce the corresponding thread into a thread with that visualizations template. (Visage treats ordinary objects as unary threads, so conversion among threads covers the general case.) Thread conversion consists of two steps. First, the template of the source thread must be mapped to that of the destination thread. All possible one-to-one mappings from subsets of the source nodes to subsets of the destination nodes are considered. Second, a destination thread is created and its nodes are bound to data objects. For each possible mapping, the data objects bound to the mapped nodes in the source thread are copied to the destination thread. Other nodes on the destination thread, if any, are initially empty. By depth-first search, the empty nodes are populated with any data object of the correct type. If at any point there are two thread nodes connected by a relationship that doesnt hold among the objects bound to those nodes, the search backtracks. (For efficiency, candidate data objects can be generated by navigation along the relationships, rather than by the object type.) All complete destination threads are added to the destination visualization.
5. Related work
5.1 GQL
GQL [9] is a fully visual conceptual level Graphical Query Language with the expressiveness of SQL. VQEs visual representation of the query graph is adapted from GQL, with some interface modifications such as using containment to show attributes rather than links. The problem with GQL as it stands is that it is not integrated with a visualization system for displaying query results. Each query generates a static table, so the paradigm is batch processing rather than the incremental query and direct manipulation exploration of VQE. There are many other conceptual level query interfaces from the database community, but all are less elegant than GQL, and none visualize results in an interesting or incremental way (see for instance many of the papers in [6]).
5.2 Exbase
Exbase [7] is similar to this work in terms of motivation, in that it seeks to provide an intermediary between a database and a visualization system. However the emphasis is on explicitly representing the history of user interaction with the database and visualizations. Lee and Grinstein distinguish remote database accesses from local processing, so there are objects for database views, which are the result of queries, and derived views, for example as the result of manipulating sliders. Similarly, they maintain a derivation history of visualization views.
We have not yet addressed the question of maintaining histories, having chosen to focus on intuitive query languages and integration of querying and visualization - topics that Exbase, which uses SQL as a query language, has not yet addressed.
5.4 Butterfly
Butterfly [8] is a citation searching and browsing application. Searching is done by selecting databases and attribute/value pairs. Browsing is done by following reference and citer links. Butterfly is able to hide the complex database queries from the user, largely because the class of queries can be anticipated. To complete the analogy with VQE, Butterfly would be able to modify queries by operations on query results. For instance, additional keywords associated with a citation might be dragged into the query.
5.5 IMACS
IMACS [4] has very similar goals to Visage/VQE. It supports analysts iterative exploration and visualization of data, including query reuse. Its foundation is the knowledge representation system CLASSIC, which is much more sophisticated than the object-oriented database we use. The primary advantage of this is that subsumption relations among queries can be inferred, allowing them to be automatically organized into the knowledge base. On the other hand, in later work the same group reverted to a simpler knowledge representation system to decrease the overhead and allow exploration of larger data sets [12].
IMACS visualizations do not support direct manipulation interaction, and it uses a textual query language. Queries are somewhat more expressive than VQEs.
6. summary
VQE combines a GQL-style intentional visual query language with direct-manipulation data exploration capabilities as found in systems like Visage, IVEE, and the Influence Explorer. Since queries and visualizations share an object oriented database, visualizations can combine attributes of multiple objects, and visualizations resulting from a sequence of queries are coordinated. Integration of extensional and intentional exploration allows use of direct manipulation where possible but still retains the ability to capture and reuse query sequences as declarative structures. VQE frames containing a sequence of nodes and links and associated visualizations can be saved and/or cleared of data to be reused with new datasets.
These capabilities are supported by the concept of threads, which we believe will be generally useful as interfaces become more application-independent, and support inter-application communication via shared object-oriented databases.
REFERENCES
[2] A. Alashqur, Stanley Su, and H. Lam: OQL: A Query Language for Manipulation Object-oriented Databases. In Proceedings of the 15th International Conference on Very Large Data Bases, 1989, pages 433-442.
[3] R. A. Becker and W. S. Cleveland. Brushing scatterplots. Technometrics, 29(2), 1987.
[4] R. J. Brachman, P. G. Selfridge, L. G. Terveen, B. Altman, A. Borgida, F. Halper, T. Kirk, A. Lazar, D. L. McGuinness, and L. A. Resnick. Integrated support for data archaeology. International Journal of Intelligent and Cooperative Information Systems, 2(2):159-185, 1993.
[5] M. C. Chuah, S. F. Roth, J. Kolojejchick, J. Mattis, and O. Juarez. Sagebook: Searching data-graphics by content. In Proceedings of the Conference on Human Factors in Computing Systems (SIGCHI '95), pages 338-345. ACM/SIGCHI, 1995.
[6] R. Cooper, editor. Proceedings of 1st International Workshop on Interfaces to Database Systems. Springer-Verlag, 1993.
[7] J. P. Lee and G. G Grinstein. Describing visual interactions to the database: closing the loop between user and data. In Proceedings of Visual Data Exploration and Analysis III (SPIE 96), 1996.
[8] J. D. Mackinlay, R. Rao, and S. K. Card. An organic user interface for searching citation links. In Proceedings of the Conference on Human Factors in Computing Systems (SIGCHI 95). ACM Press, 1995.
[9] A. Papantonakis and P. J. H. King. Syntax and semantics of GQL, a graphical query language. Journal of Visual Languages and Computing, 6:3-25, 1995.
[10] S. F. Roth, M. C. Chuah, S. Kerpedjiev, J. A. Kolojejchick, and P. Lucas. Towards an information visualization workspace: Combining multiple means of expression. Human-Computer Interaction, in press, 1997.
[11] S. F. Roth, P. Lucas, J. A. Senn, C. C. Gomberg, M. B. Burks, P. J. Stroffolino, J. A. Kolojejchick, and C. Dunmire. Visage: A user interface environment for exploring information. In Proceedings of Information Visualization, pages 3-12. IEEE, 1996.
[12] P. G. Selfridge, D. Srivastava, and L. O. Wilson. Idea: Interactive data exploration and analysis. In Proceedings of SIGMOD 1996, 1996.
[13] Z.-H. Tang, G. Gardarin, and V. Smahi. Optimizing path expressions using navigational algebraic operators. In Proceedings of Database and Expert Systems Applications, DEXA '96, pages 574-583, 1996.
[14] L. Tweedie, R. Spence, H. Dawkes, and H. Su. Externalising abstract mathematical models. In Proceedings of the Conference on Human Factors in Computing Systems (SIGCHI '96), pages 406-412. ACM/SIGCHI, 1996.