Sonification of mass spectrogram of brain lipids from
injured brain tissue.
Nyquist is a powerful language and system for sonification of
scientific data. Nyquist is a full programming language able to read
files and process data in addition to sound synthesis, so Nyquist can
automate the full sonification process from data to sound.
This page offers examples that produce sound from
mass spectrogram data. There are six files, but they represent 3 sets
of data. The brief explanation is that these are mass spectra of brain
lipids from three different tissue samples. A normal one ("control"),
one from an injured brain ("trauma") and one from an injured brain
after treatment with a medication ("xjb"). Mass spectra are serial
data, with each ion detected as its mass-to-charge ratio (M/z) and the
corresponding intensity (a measure of how many ions of that same m/z
are being detected). Thus the csv files have the m/z in one column and
intensity in the other. These have been split into two files (m/z
and intensity). With the mass spec instrument
settings used for this, we know that the charge (z) on the ions is
1. Therefore m/z is also the mass of the ions.
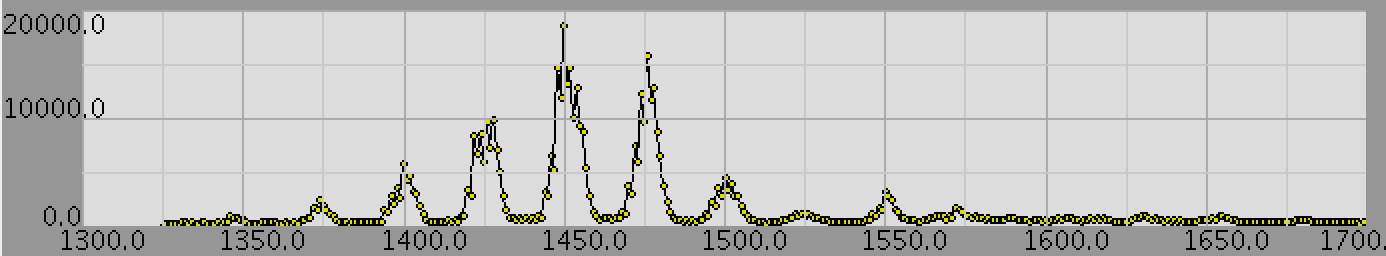
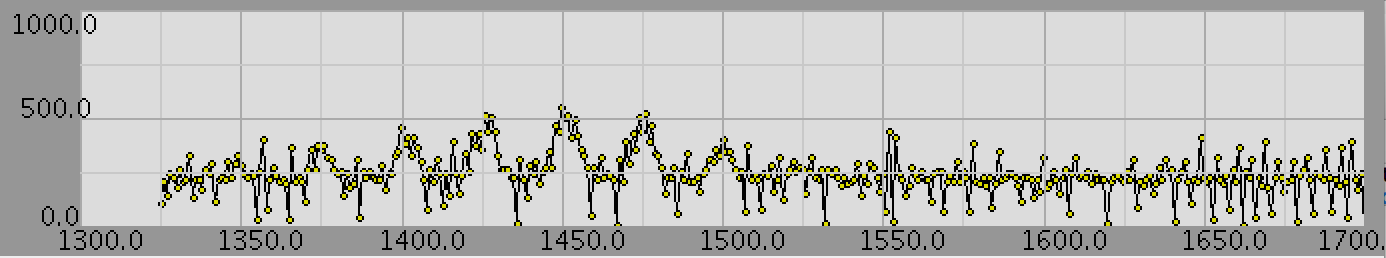
The mass range that we are looking at with these samples
(m/z=1325 to 1700) indicates that these ions are a particular
type of lipid species ("cardiolipin"). The trauma sample has lots of
species in the upper part of the mass range (above 1520 or so) that
the normal sample does not. We know from other work that these are
oxidized cardiolipin species, and something very much of interest.
In the data, there are some cases where the same M/z ratio appears
twice with different corresponding intensities. I assumed that the
“true” intensity for those M/z ratios is the sum
of the given intensities. There is some code in
data-reader.sal to combine pairs of files (M/z and intensity)
to a single array of number pairs, and the file data-plot.sal
contains the function pairs-to-array, which forms an array
representing the intensities for M/z ratios from 1325 to 1700. The
algorithm is basically:
    create an array of length 1700 - 1325 + 1
    initialize the array to all zeros
    for each pair (mz, intensity) in the data,
        increment the_array[mz - 1325] by intensity
Note that the array is indexed starting with 0, so index 0 contains
the intensity for M/z ratio 1325, etc.
In the following, the datasets are referred to
with the names control1, trauma1, and xjb1.
There are five different files for each of these names:
The original data has the extension
“.txt”. These files are in csv format but
contain just a single column of numbers.
A conventional plot of the data has the extension
“.png”. The x-axis is the row number of
the data item, starting from zero, and the y-axis is the value of
the data item.
The first sonification performs a sequence of notes representing
the list of numbers provided in the data. The pitch is based on the
data values. The mapping from value to pitch maps the range 0 to
20000 into the range of MIDI key numbers from 30 to 110. The mapped
numbers are rounded to the nearest semitone. These sonification
files end in “-ps.wav”
The second sonification is like the first but duration is longer
for higher data values. The duration mapping is approximately
logarithmic, using a duration of 0.1 ⋅ log(x/20000 ⋅ 80 + 1). Note
that a linear mapping from value to duration would result in longer
notes being thousands of times longer than short notes. The
logarithmic mapping gives a more listenable range of durations N.
The third sonification treats each data value as the amplitude of
a sinusoidal partial at the frequency indicated by the row
number. Frequencies are more-or-less evenly spaced from about 100 to
8000 Hz, and amplitudes cover a range of about 24 dB. Some random
phase and frequency offsets are used to reduce artifacts related to
a perfect frequency spacing.
In the following, you will find links to all of the files.