
There are surprisingly many concepts related to the “loudness” of sound. Loudness itself is a perceptual concept, while amplitude is a physical concept.
There are multiple ways of defining amplitude. One de nition is: "a measure of a periodic function's change over a single period." Figure 1 illustrates the three different ways amplitude may be measured:
The peak amplitude
The peak-to-peak amplitude
The root mean square (RMS) amplitude
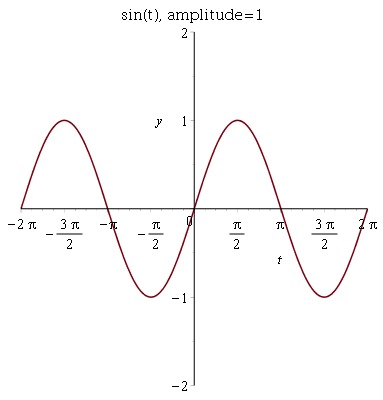


In class, we are mostly concerned with the peak amplitude of a signal. Thus, the amplitude of a sine wave, \(y = \sin(t)\), is 1, and the amplitude of \(y = 2 \cos(t)\) is 2 (see Figure 2). When we multiply an oscillator in Nyquist by an envelope, we’re varying the amplitude of that oscillator over time (see Figure 2 at right).
According to the American National Standards Institute loudness is:
Loudness is a perceptual concept. Equal loudness does necessarily result from equal amplitude because the human ear’s sensitivity to sound varies with frequency. This sensitivity, the loudness, is depicted in equal-loudness contours for the human ear; often referred to as the Fletcher-Munson curves. Fletcher and Munson’s data were revised to create an ISO standard. Both are illustrated in Figure 3 below. Each curve traces changes in amplitude required to maintain equal loudness as the frequency of a sine tone varies. In other words, each curve depicts amplitude as a function of frequency at a constant loudness level.

Loudness is commonly measured in Phons.
Phon expresses the loudness of a sound in terms of a reference loudness. That is, the phon level of a sound, \(A\), is the dB SPL (defined below) of a reference sound - of frequency 1 kHz - that has the same (perceived) loudness as \(A\). Zero phon is the limit of audibility of the human ear; inaudible sounds have negative phon levels.
There is no one formal definition for what the volume of sound means. Generally, volume is used as a synonym for loudness. In music production, adjusting the volume of a sound usually means to move a volume fader on e.g. a mixer. Faders can be either linear or logarithmic, so again, it is not exactly clear what volume means (i.e. is it the fader position, or the perceived loudness?).
Power is the amount of work done per unit of time; e.g. how much energy is transferred by an audio signal. Hence, the average power \(\overline{P}\) is the ratio of energy \(E\) to time \(t\): \(\overline{P}={\frac {E}{t}}\). Power is usually measured in Watts; joules per second = Watts, \({\frac {J}{s}}=W\). The power of a sound signal is proportional to the squared amplitude of that signal. Note that in the context of panning, it does not really matter how we define amplitude. Whether we think of amplitude as the instantaneous amplitude (i.e. the amplitude at a specific point in time), or the peak, the peak-to-peak, or the root mean square amplitude over a single period makes no significant difference.
In general, the pressure \(p\) is the amount of force \(F\) applied perpendicularly (normal) to a surface area divided by the size \(a\) of that area: \(p={\frac {F}{a}}\). Pressure is normally measured in Pascal (Pa), which is newtons per square meter. Thus, \({\it Pa}={\frac {N}{{m}^{2}}}\).
Intensity \(I\) is the energy \(E\) flowing across a unit surface area per unit of time \(t\): \(I={\frac {E}{a}}{\frac{1}{t}}\). For instance, the energy from a sound wave flowing to an ear. As the average power \(\overline{P}={\frac {E}{t}}\), we can express the intensity as \(I=\overline{{\frac {P}{a}}}\), meaning the power flowing across a surface of area \(a\). The standard unit area is one square meter, and therefore we measure intensity in \({\frac {W}{{m}^{2}}}\); i.e. Watts per square meter.
Just as the frequency range of the human ear is limited, so is the range of intensity. For a very sensitive listener, and a 1 kHz frequency:
The threshold of hearing \(t_{{h}}= 10^{-12}\) \(W / m^2\)
The limit of hearing \(l_{h}=1 \) \(W/m^2\) (the threshold of pain).
The perceptual range of intensity for a 1 kHz frequency is an impressive \({\frac {l_{{h}}}{t_{{h}}}} = \frac{1}{10^{-12}} = 10^{12}\), or a trillion to one.
Bel is a sound intensity scale named in honor of the renowned Alexander Graham Bell (1847-1922). Given the enormous range of human hearing, one Bel is defined as a factor of 10 in intensity or power, and thus we get:
\[\frac{l_h}{t_h}=\log_{10} \frac{1}{10^{-12}} W / m^2 = 12 Bel.\]
In other words, Bel is the log ratio of intensity or power.
Using just a range of 12 to express the entire range of hearing is inconvenient, so it is customary to use decibels, abbreviated dB, instead:
\[10 \log_{10} \frac{l_h}{t_h}=10\log_{10} \frac{1}{10^{-12}} W/m^2 = 120 dB.\]
Hence, the intensity range of human hearing is 120 dB.
Decibels can be used to compare the intensity levels of two sounds. We can take the intensity \(I\) of some sound and compare it to a reference intensity \(I_{ref}\):
\[10 \log_{10} \frac{I}{I_{ref}}\]
So for example, instead of using \(t_h\) as the reference intensity, we could use the limit of hearing \(l_h\), and thus measure down from pain instead of measuring up from silence.
A common confusion arises when working with intensity and amplitudes. We just saw that given an intensity ratio \(r\), we can express the ratio in decibels using \(10 \log_{10} r\). This also works for a ratio of power because power and intensity are proportional. However, when we are working with amplitudes, this formula does not apply. Why? Because decibels is a measure of power or intensity ratio. Since power is proportional to the square of amplitude, a different formula must be used for amplitudes. For two amplitudes \(A\) and \(B\), we can use the power formula if we square them. Then we can simplify the expression:
\[dB = 10 \log_{10} \frac{A^2}{B^2} = 10 \log_{10} (\frac{A}{B})^2 = 20 \log_{10} \frac{A}{B}\]
Main idea: for power or intensity we use \(10 \log_{10} ratio\), but for amplitudes, we must use \(20 \log_{10} ratio\).
dBa uses the so-called A-weighting to account for the relative loudness perceived by the human ear; based on equal-loudness contours.
dBb & dBc are similar to dBa, but apply different weighting schemes.
dBm (or dBmW) is the power ratio in dB of a measured power referenced to one milliwatt (mW); used e.g. in radio, microwave and fiber optic networks as a measure of absolute power.
dB SPL see below.
In a music studio, we usually want to measure down from the limit of the loudest sound that can be recorded without introducing distortion from the recording equipment. This is why it is standard for e.g. mixing consoles and music software to use volume faders and meters that show negative dB. In this context, 0 dB is the upper limit for recording without distortion; let’s call it the limit of recording = \(l_r\) . Hence, the loudest sound we may record without any distortion has intensity \(I = l_r\) , and the corresponding dB is \(10 \log_{10} \frac{l_r}{l_r}\) = 0 dB. Note that it is customary for producers of recording gear to leave some amount of head room at the top of this scale to safeguard against distortion, which is why you’ll see some positive dB values above 0 dB on meters and faders.
Measuring the intensity of a sound signal is usually not practical (or possible); i.e. measuring the energy flow over an area is tricky. Fortunately, we can measure the average variation in pressure. Pressure is the force applied normal to a surface area, so if we sample a sufficiently large area we’ll get a decent approximation; this is exactly what a microphone does!
It is worth noting, that we can relate sound pressure to intensity by the following ratio,
\[{\frac {{\Delta p}^{2}}{V\delta}}\]
where \(\Delta p\) is the variation in pressure, \(V\) is the velocity of sound in air, and \(\delta\) is the density of air. What this tells us is that intensity is proportional to the square of the variation in pressure.
Sound pressure level is defined as the average pressure variation per unit area. The dB SPL is defined as \(20 \log_{10} \frac{P}{P_0}\), where the reference pressure, \(P_0\), is 0.00005 Pa, which is approximately the threshold of hearing at 1 kHz.
Most microphones use electromagnetic induction to transform the sound pressure applied to a diaphragm into an electrical signal; as shown in Figure 4.

For more information on loudness, dB, intensity, pressure etc., see Musimathics Vol. 1 by Gareth Loy (The MIT Press).
Now that we understand loudness, we can begin to talk about panning. As with loudness, there is a bit more to it than one would initially think. When panning a mono source from left to right in a stereo output, you are basically adjusting the volume of that source in the left and right channels. Simple enough. However, there are multiple reasonable ways of making those adjustments. In the following, we shall cover the three most common ones.
A typical two-speaker stereo setup is depicted in Figure 5; the speakers are placed symmetrically at \(\pm 45\)-degree angles, and equidistant to the listener, who is located at the so-called “sweet-spot,” while facing the speakers.
Note that the range of panning (for stereo) is thus 90 degrees. However, it is practical to use radians instead of degrees. By convention, the left speaker is at 0 radians and the right speaker is at \(\frac{\pi}{2}\) radians, giving us a panning range of \(\theta \in [0;\frac{\pi}{2}]\), with the center position at \(\theta = \frac{\pi}{4}\).
The simplest panning strategy is to adjust the channel gains (volumes) linearly with inverse correlation.
Main idea: for a stereo signal with gain 1, the gains of the left and right channels should sum to 1; i.e. \(L(\theta) + R(\theta) = 1\).
With the panning angle \(\theta \in [0;\frac{\pi}{2}]\) we thus get the gain functions
\(L(\theta)=(\frac{\pi}{2}-\theta)\frac{1}{\frac{\pi}{2}}=(\frac{\pi}{2}-\theta)\frac{2}{\pi}\), and \(R(\theta)=\theta \frac{1}{\frac{\pi}{2}}=\theta \frac{2}{\pi}\)
as plotted in Figure 6.


A drawback of implementing panning in this way is, that even though the gains \(L(\theta)\) and \(R(\theta)\) always sum to 1, the loudness of the signal is still affected. It creates a “hole-in-the-middle” effect, such that the signal is softer at the middle than at the side-positions. At the center position, where \(\theta = \frac{\pi}{4}\), we have \(L(\frac{\pi}{4}) + R(\frac{\pi}{4}) = 1\).
However, when a signal is panned to the center, the amplitudes coming from two speakers will typically not sum (unless they are perfectly in phase). In general, due to reflections and phase differences, the power is additive. If we add power (proportional to the squared amplitude) we get \(L^2(\frac{\pi}{4})+R^2(\frac{\pi}{4})=0.5^2+0.5^2=0.5\). Expressed in dB, measuring down from the maximum gain (amplitude) of 1 (0 dB), we get \(10 \log_{10}(0.5) dB = -3 dB\).
One way of dealing with the “hole-in-the-middle” effect is to use emph constant power panning. Basically, we exchange the linear function for \(L(\theta)\) and \(R(\theta)\) with the sine and cosine functions, letting \(L(\theta) = \cos(\theta)\) and \(R(\theta) = \sin(\theta)\).
Main idea: power is proportional to the squared amplitude, and \(\cos^2 + \sin^2 = 1\), thus \(L(\theta) = \cos(\theta)\) and \(R(\theta) = \sin(\theta)\) yields constant power panning.

As seen in the Figure 7, this boosts the center, giving us a gain of \(\cos(\frac{\pi}{4}) = sin(\frac{\pi}{4}) = .71\) as opposed to the .5 center gain we saw with linear panning. Now, the power of the signal at the center is \(L^2(\frac{\pi}{4})+R^2(\frac{\pi}{4}) = \cos^2(\frac{\pi}{4})+\sin^2(\frac{\pi}{4})=1\) , which is \(10 \log_{10}(\frac{1}{1}) dB = 0 dB\). The per-channel attenuation is \(20 \log_{10}(0.71) = -3 dB\). Thus, the center pan position is boosted by 3 dB compared to linear panning, and the total power at every pan position is 0 dB.
What if our statement that power is additive is wrong? If amplitudes add, then the center pan position will get a 3 dB boost. This can happen if you convert stereo to mono by adding the left and right channels. Also, there should be a sweet spot exactly equidistant from the two speakers where sounds add in phase so that amplitudes are actually additive. The idea behind the -4.5 dB law is to split the difference between constant power and linear panning - a kind of compromise between the two. This is achieved by simply taking the square root of the product of the two laws, thus we have \(L(\theta)=\sqrt{(\frac{\pi}{2}-\theta)\frac{2}{\pi} \cos(\theta)}\), and \(R(\theta)=\sqrt{\theta \frac{2}{\pi} \sin(\theta)}\); as plotted in Figure 8.

As we can see on the plot, the center gain is now at 0.59, and hence the per-channel attenuation is \(10 \log_{10} (\frac{.59^2}{1^2}) dB = -4.5 dB\), which is exactly in between that for the previous two laws. The power of the signal at the center is now \(L^2(\frac{\pi}{4})+R^2(\frac{\pi}{4}) = .59^2+.59^2=0.7\), corresponding to \(10 \log_{10}(\frac{.59^2+.59^2}{1^2})dB=-1.5dB\). If amplitudes are additive when stereo is converted to mono, the center pan signal is boosted by 1.5 dB.
According to a number of sources (and as an interesting historic aside), back in the 1930s, the Disney corporation tested different pan laws on human subjects, and found that constant power panning was preferred by the listeners. Then, in the 1950s,
the BBC conducted a similar experiment and concluded that the -4.5 dB compromise was the better pan law. Now, we know next to nothing about the details of those experiments, but their results might make sense if we assume that Disney’s focus was on
movie theaters and the BBC’s was on TV audiences. Let’s elaborate on that. It all depends on the listening situation. That is, how are the speakers placed, what is the size of the room, where is the listener placed, and can we expect the listener
to stay in the same place? If the speakers are placed close to each other in a small room (with very little reverb) or if the listener is in the sweet spot, then one can reasonably expect that the phases of the signals from the two speakers will add
up constructively (at least at lower frequencies, acting pretty much as one single speaker (at least at lower frequencies); as depicted in Figure 9.

In such a case where signals are in phase so that the left and right amplitudes sum, the sounds that are panned to the center will experience up to 3dB of boost with constant power panning but a maximum of only 1.5dB boost using the -4.5 dB compromise. Thus, the -4.5 dB rule might give more equal loudness panning. It could also be that the BBC considered mono TV sets where the left and right channels are added perfectly in phase. In this case, the -4.5 dB compromise gives a 1.5 dB boost to center-panned signals vs. a 3 dB boost with constant power panning. (Recall that linear panning is ideal for mono reproduction because the center-panned signals are not boosted at all. However, linear panning results in the “hole-in-the-middle” problem for stereo.)
On the other hand, if the speakers are placed far from each other in a big room, then the phases will not add up constructively; as seen in Figure 10.

Furthermore, in this case, the listeners are probably not always placed at the sweet spot - there are probably multiple listeners placed at different distances and angles to the speakers (as e.g. in a movie theater). One would expect constant power panning to produce more uniform loudness at all panning positions in this situation.
Given the variables of listener position, speaker placement, and possible stereo-to-mono conversion, there is no universal solution that optimizes panning. Both constant power panning and the -4.5 dB compromise are widely used, and both are preferred over linear panning.