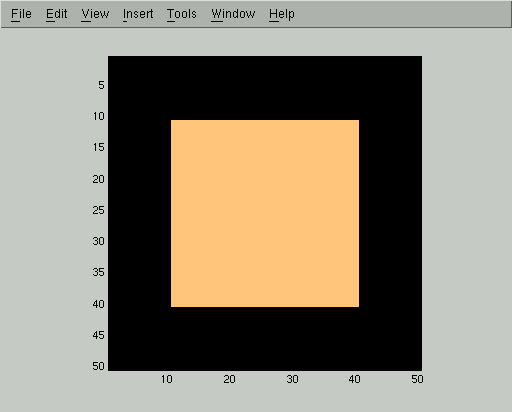
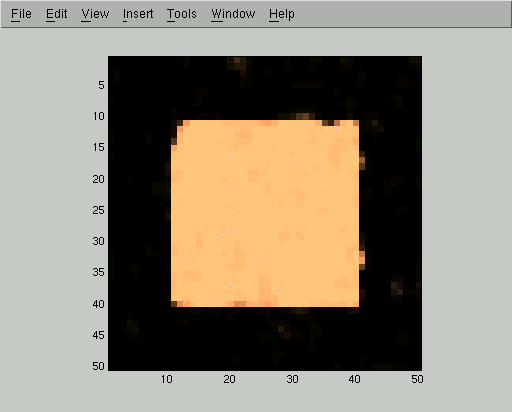
This image is represented as an array of reals X, with light colors corresponding to entries of +1 and dark colors corresponding to entries of -1. We then corrupt the image with white noise of standard deviation 1:
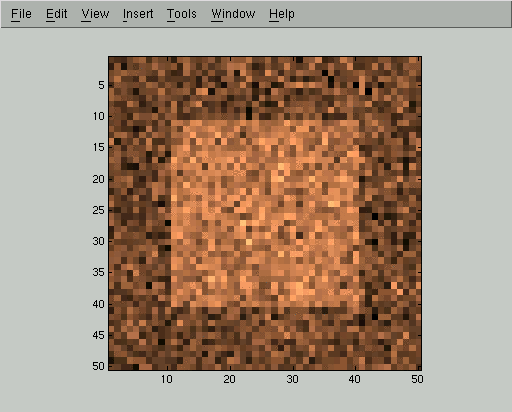
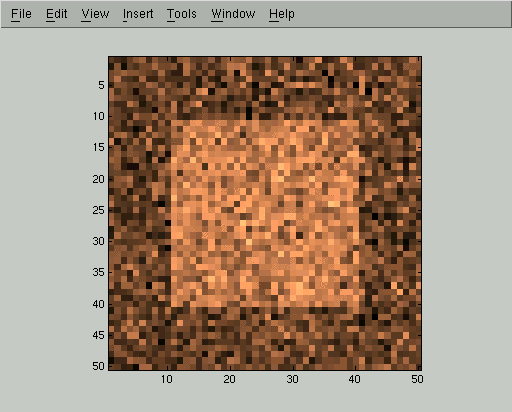
In this corrupted image Y we can still easily see the square, but the naive approach of thresholding pixel values cannot segment it out:
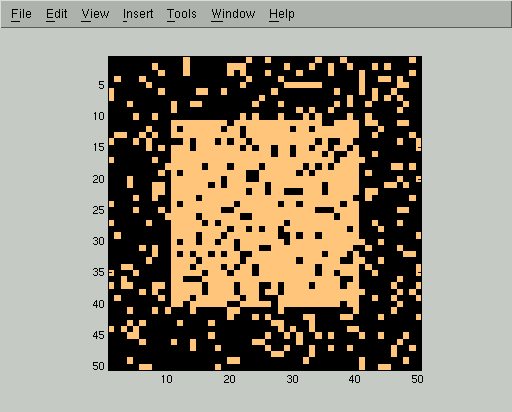
So we need to use some sort of image model to accomplish the segmentation. We will use the following simple prior over images X, which encodes the intuition that neighboring pixels are likely to belong to the same class:
P(X) = exp(-sumij C (X(i) - X(j))2) / Z
Here the sum is over all pixels i and, for each i, over the 4 neighbors j of i. X(i) is assumed to be either +1 or -1, so the sum contributes 4C for each time X(i) disagrees with a neighbor X(j). In other words, the constant C controls the magnitude of the penalty for pixels which disagree with their neighbors. The number Z is a normalizing constant which ensures that P(X) is a true probability distribution. It is difficult to compute Z exactly, so we will need to make an approximation later.
Given this prior over images, we can use Bayes' rule to write:
P(X | Y) = P(Y | X) P(X) / Z
Here Z is another normalizing constant. (We're just going to collect all of the normalizing constants together at the end, so we're abusing notation by using the letter Z for all of them rather than trying to keep track of each one individually.) We have just described P(X), so now let's look at P(Y | X).
We will use a very simple model for how observed images are generated from true images:
P(Y | X) = exp(-sumi D (X(i) - Y(i))2) / Z
This expression says that the observed image is produced from the true image by adding independent Gaussian random noise at each pixel. The constant D controls the variance of this Gaussian.
Now we can write the posterior over true images as:
P(X | Y) = exp( - (sumij C (X(i) - X(j))2 + sumi D (X(i) - Y(i))2)) / Z
This posterior tells us that a true image X is likely if it agrees well with the observed image Y and if it usually classifies neigboring pixels into the same class. The constants C and D trade off the magnitude of these two effects.
Now we need to start making approximations. We will approximate the true posterior P(X | Y) by a distribution Q(X) which has a simple form, and then we will seek the Q which minimizes the KL-divergence from the true posterior:
KL(Q | P) = EQ(log(Q) - log(P))
For our simple form, we will pick distributions Q which factor over pixels. That is, we will use only Qs which can be written
Q(X) = prodi Qi(X(i))
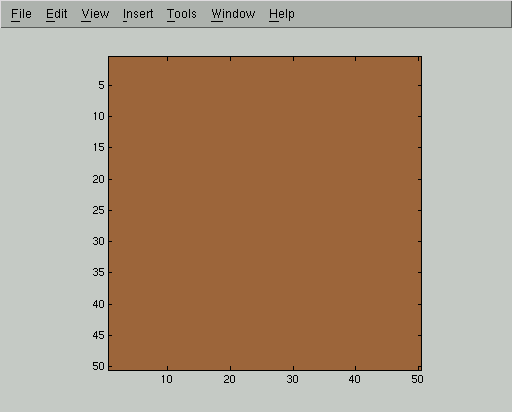
One nice thing about this form is that we can plot a probability distribution Q as an image where the gray level of pixel i is proportional to Qi(+1), that is, the probability that pixel i was generated from a true underlying image where pixel i had class +1. Here is the distribution in which each Qi(+1) is .5, that is, in which we have no information about the class of any pixel:
By taking the derivative of the KL divergence written above and setting it to 0, we can show that the optimal Q must satisfy the equations:
Qi = tanh(2 D Y(i) + 2 C sumj Qj)
for each i. Here the sum is over the 4 neighbors j of pixel i, and Qi is shorthand for [Qi(+1)-Qi(-1)]. For details of this derivation, see Deriving variational bounds.
We can solve the mean field equations by starting at any distribution Q (such as the uninformative distribution shown above) and iteratively relaxing the equations until convergence. Relaxing the equations means using the right hand side to compute a new target value for Qi, then moving our estimate of Qi closer to this target value at a speed governed by an arbitrary learning rate.
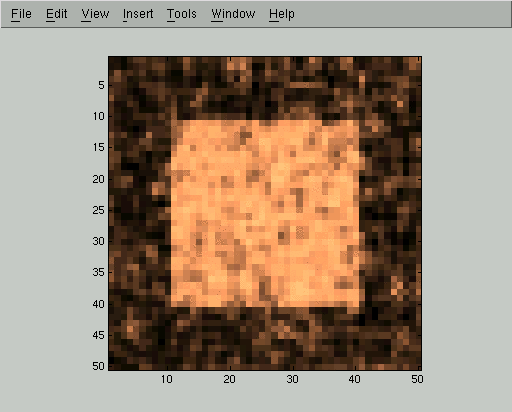
Each iteration of the mean field relaxation will improve our estimate of Qi, so long as we use a small enough learning rate. Here are displays of Qi(+1) for the first 5 iterations of the mean field algorithm. In these images, high probability of belonging to the foreground class corresponds to bright gray levels. We used the parameters D=0.1 and C=1 and a learning rate of 0.5, but the same qualitative behavior happens for a wide range of parameters.
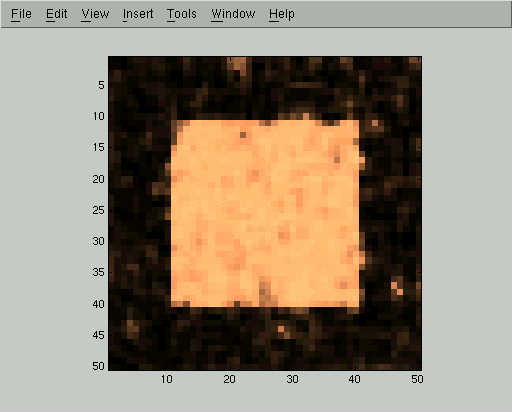
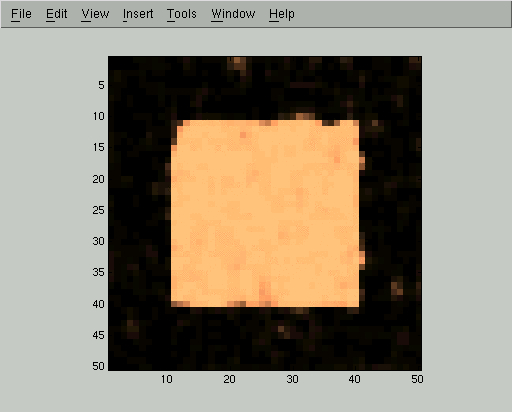
At this point the mean field iteration has gotten to a pretty good approximation, but we can run it for a few more steps to improve even more:
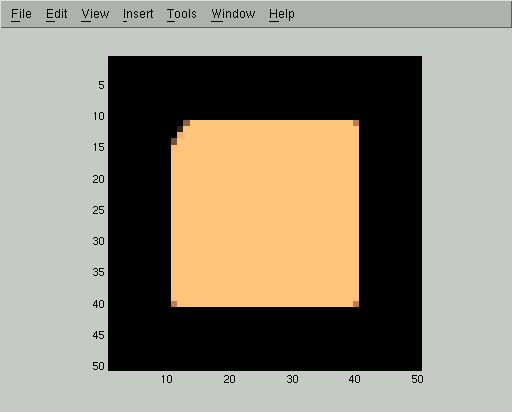
Now we can threshold the approximating distribution to get a much more accurate segmentation than we could have produced from the raw image:

This new segmentation makes errors only at the upper left corner of the image. In fact, looking back at the starting image
we can see that the upper left corner has been corrupted enough by the noise that it is in fact questionable (based only on the assumptions we have given the mean field algorithm and not on our knowledge of what squares look like) whether it should be included in the foreground or the background.
Here is the Matlab source which generated the images on this page. This page is maintained by Geoff Gordon and was last modified in November 2002.