Empirical system reliabilityĀ People
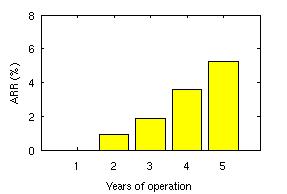
OverviewSystem reliability is a major challenge in system design. Unreliable systems are not only major source of user frustration, they are also expensive. Avoiding downtime and the cost of actual downtime make up more than 40% of the total cost of ownership for modern IT systems. Unfortunately, with the large component count in today's large-scale systems, failures are quickly becoming the norm rather than the exception. We believe that the key to building more reliable systems is to first better understand what makes system unreliable, i.e. what do failures in today's large-scale production systems look like. Although system reliability has been a key concern since the first computer systems were build 50 years ago, we know embarrassingly little about basic characteristics of failures in real systems. Much research, in industry as well as academia, is based on hypothetical and often simplistic assumptions, e.g. ``the time between failures is exponentially distributed'' and ``failures are independent''. The reason is that there is virtually no data on failures in real large-scale systems publicly available that could be used to derive more realistic models. The longterm goal of this project is to enable creation of more reliable systems through deeper understanding of real-world failures. So far we have collected and analyzed failure data on node outages in more than 20 large HPC clusters [FAST07] and data on storage failures in several large production systems [DSN06]. Our initial analysis shows that many commonly used models and assumptions about failures are not realistic. Below we first describe some of our recent results and then outline our longterm research agenda. Recent workFailures in storage systemsAs part of this project, we analyzed field-gathered disk replacement data from a number of large production systems, including high-performance computing sites and internet services sites. About 100,000 disks are covered by this data, some for an entire lifetime of five years. The data include drives with SCSI and FC, as well as SATA interfaces. The mean time to failure (MTTF) of those drives, as specified in their datasheets, ranges from 1,000,000 to 1,500,000 hours, suggesting a nominal annual failure rate of at most 0.88%. Below is a summary of a few of our results.
Failures in high-performance computing clustersStatistical properties of failure processes
Longterm research agenda
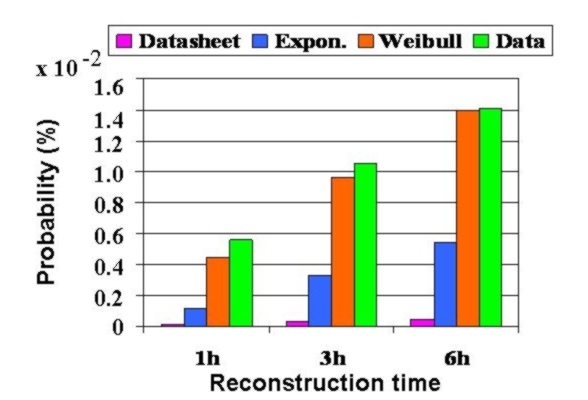
Collecting failure dataOur plan is to collect detailed failure data from a diverse set of real, large-scale production systems that cover all aspects of system failures: software failures, hardware failures, failures due to operator error, network failures, and failures due to environmental problems (e.g. power outages). At this point, we have established relationships with more than a dozen large commercial sites and high-performance computing (HPC) sites, five of which have already contributed data. We are currently working with the Usenix Association to create a public failure data repository to host these data. A first draft of the repository can be viewed here .While collecting and sharing failure data might seem like a purely mechanical process, it turns out that it involves many research questions by itself. One question is, for example, how to efficiently and reliably sanitize and anonymize Gigabytes of free-form text data, such as trouble tickets. Several of these problems will require techniques from other areas. For example, I plan to investigate the use of methods from text analysis and document retrieval to help automate anonymization and analysis of free-form text data. Analyzing failure dataOur initial results indicate the strong need for new, more realistic failure models. We plan to identify and characterize the most relevant aspects of failure behavior in large IT systems with the goal of deriving accurate failure and repair models for a wide range of systems. Important aspects could, for example, include various statistical properties of the failure process, but also correlations between system parameters, such as workload, and the failure behavior. The results of this work will provide a more realistic basis for both experimental and analytical research on system reliability. While our initial results above are very recent, they are already being used by several researchers to parameterize their experiments and simulations.In our analysis we plan to use not only traditional statistical methods, but also to investigate techniques from data mining, which might be particularly useful in identifying relationships and correlations between various aspects of system behavior and observed failure modes. A key question will be how complex new failures models need to be. While highly complex models with a large number of parameters will provide a better fit to observed data, they not only pose a risk of overfitting, but will also be harder to use, since they are computationally and intuitively more complex. We are looking for the simplest models that still provide realistic results. Exploiting failure dataArmed with more realistic failure models, a natural next step will be to re-examine existing algorithms and techniques for fault-tolerant systems to understand where simpler (standard) models result in poor design choices and for those cases explore new algorithms. In preliminary work we revisit, for example, the old question of estimating the probability of losing data in a RAID system. We find that the probabilities derived with standard methods (assuming exponential time between failures and independent failures) can be two orders of magnitude lower than estimates derived from real data.As one example of the impact of using simple, standard models rather than real data consider Figure 5 below. The figure shows the probability that a second drive in a RAID fails during reconstruction, derived in four different ways: the purple bar estimates the probability based on exponential time between failures using the datasheet MTTF; the blue bar estimates the probability based on exponential time between failures, but using the actual empirical MTTF; the orange bar uses a Weibull distribution fit to empirical data; and the green bar shows the estimates directly derived from the data. As the graph shows the estimates derived using the standard approach (pink and blue bar) can greatly underestimate the probability of a RAID failure.
Publications
The work on this project has so far resulted in two conference publications, which are listed below.
Related projects
We have also worked on a number of other projects that are closely related to this project:
AcknowledgementsWe would like to thank Gary Grider, Laura Davey and Jamez Nunez from the High Performance Computing Division at Los Alamos National Lab and Katie Vargo, J. Ray Scott and Robin Flaus from the Pittsburgh Supercomputing Center for collecting and providing us with data and helping us to interpret the data. We also thank the other people and organizations, who have provided us with data, but would like to remain unnamed. For discussions relating to the use of high end systems, we would like to thank Mark Seager and Dave Fox of the Lawrence Livermore National Lab. For questions and comments regarding this page, please contact Bianca Schroeder.
Last updated
03 January, 2007
|