Homework 4
Due Monday 10-Feb, at 9:00pm
To start
- Create a folder named ‘hw4’
- NOTE: This is a two-part homework. You should download two starter files. Download hw4a.py and d hw4b.py to that folder
- Install the CMU Graphics on your computer: follow the instructions posted on Discord, or download the library inside that folder.
- Edit hw4a.py and hw4b.py and modify the functions as required
- When you have completed and fully tested any of the parts, submit it to Gradescope. For full credit, you should complete both parts. For part A, you may submit up to 999 times, but only your last submission counts. For part B, you may submit up to 15 times.
While you may submit part A to Gradescope as often as you like for this assignment, some questions are not autograded, so you will be responsible for testing your code and making sure it meets the problem requirements. As stated in the style guide, you do not have to write test cases for interactive, random, graphics, data initialization or event functions. Instead, you should test by visually inspecting your code’s behavior as you complete steps of each problem, where reasonably possible. This will make debugging your code much easier.
Some important notes
- This homework is individual. You are expected to write your own code and submit work that reflects your own understanding. You may discuss concepts with other students in the course, and you may use permitted resources, but you must follow the collaboration policy:
- Do not copy code from any source.
- If you look at code that you did not write, you must follow the 5-Minute Rule.
- You are responsible for protecting your own work so others cannot copy it. See the academic honesty policy for more details.
- After you submit to Gradescope, make sure you check your score. If you aren’t sure how to do this, then ask a CA or Professor.
- There is no partial credit on Gradescope testcases. Your Gradescope score is your Gradescope score.
- Read the last bullet point again. Seriously, we won’t go back later and increase your Gradescope score for any reason. Even if you worked really hard and it was only a minor error…
- Do not hardcode the test cases in your solutions.
- The starter
hw4.pyfile includes some test functions to help you test on your own before you submit to Gradescope. When you run your file, problems will be tested in order. If you wish to temporarily bypass specific tests (say, because you have not yet completed some functions), you can comment out individual test function calls at the bottom of your file inmain(). However, be sure to uncomment and test everything together before you submit! Ask a CA if you need help with this. - Remember the course’s academic integrity policy. Solving the homework yourself is your best preparation for exams and quizzes; cheating or short-cutting your learning process in order to improve your homework score will actually hurt your course grade long-term.
Limitations
Do not use sets, dictionaries, recursion, or anything we have not yet covered in class or the notes. The autograder (or a manual CA review later) will reject your submission entirely if you do.
A Note About Style Grading
Like in the previous assignment, we will be grading your code based on whether it follows the 15-112 style guide. We may deduct up to 10 points from your overall grade for style errors. We highly recommend that you try to write clean code with good style all along, rather than fixing your style issues at the end. Good style helps you code faster and with fewer bugs. It is totally worth it. In any case, style grading already started, so please use good style from now on!
Problems
PART A (Graphics, manually graded)
-
drawQatarFlag(width=760, height=300): [20 pts, manually graded]
Write the function drawQatarFlag which draws the Qatar flag in the provided dimensions. You can assume that the height:width ratio will be close to 11:28, as is the case with the actual Qatar flag.
You can find much useful information about the flag's dimensions and colors on Wikipedia, but we do not expect you to match the actual Qatar flag design perfectly; you should instead seek to create a reasonable approximation of the flag. However, your flag must meet the following requirements:
- The flag should cover the entire provided width and height
- The flag should have the correct number of zig-zags
- The colors should be correct (Note: The flag is not red...)
For examples of what a reasonable flag might look like, here is an instructor-created flag:

-
drawBarChart(width, height, data) [20 pts, manually graded]
Write a program that draws a bar chart that shows the distribution of values in data, where data represents a list of items encoded as a multi-line string where every line contains label and an integer, separated with a colon. For instance,data = """bananas:2 oranges:3 apples:4 pineapple:1"""will produce the following bar chart:
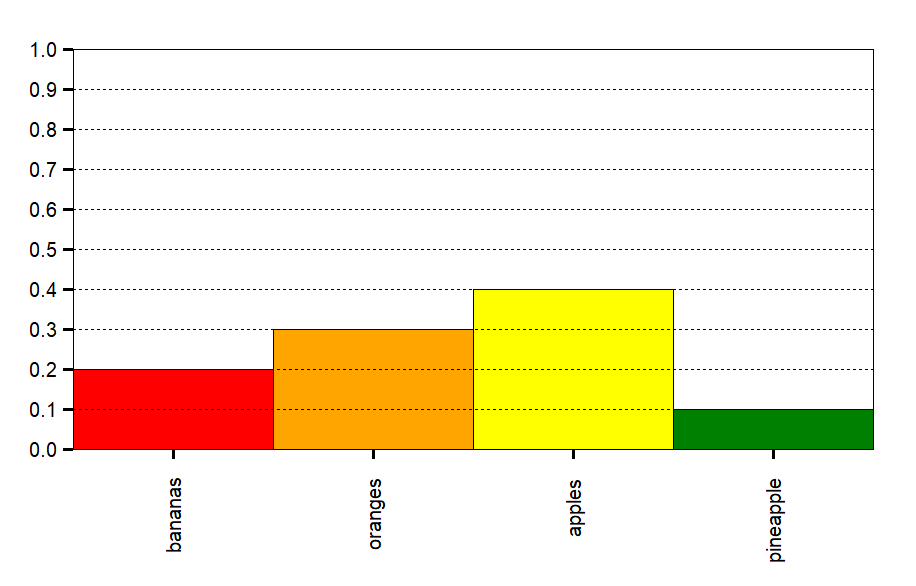
In this example,
Here are some details on the parameters of the chart.datarepresents a list of 10 items: 2 bananas, 3 oranges, 4 apples, and 1 pineapple. In other words, a 0.2 fraction of the items indataare bananas, 0.3 oranges, 0.4 apples and 0.1 pineapple.- The chart must have 11, equally-spaced y-ticks on the y-axis with labels 0.0, 0.1, ..., 1.0
- Draw dashed lines from left to right as shown in the example, aligned with each y-tick.
- The chart must have n equally spaced x-ticks on the x-axis, where n is the number of unique values in
data. Each tick should be labeled with the corresponding word in a vertical orientation. - There should a reasonable separation between the tick labels and the axes.
- The chart should span as much window space as possible within the given dimensions.
- All bars should be next to each other, without gaps in between.
- The height of each bar should be proportional to the frequency of the item in the list: it should represent the fraction value in the plot.
- Do not worry about rounding when calculating the height.
- You can choose the colors however you would like, but you should make sure you can support at least 6 different colors and no adjacent bars should have the same color.
-
drawNiceRobot(width, height) [25 pts, manually graded]
Write a functiondrawNiceRobot(width, height)that (you guessed it!) draws a nice robot! This is not meant to be very difficult. We just want to see some really cool robots while grading your homework. Your function must make a drawing using the 112 graphics library that meets the following criteria:- Easily identifiable as a robot
- Includes at least 10 shapes total, including at least one oval, one rectangle, one non-rectangular polygon, and one line
- Uses at least 4 colors
- Resizes with the canvas. (You may assume that the canvas will always resize proportionally, and you may change the starting proportions in the test case if you want to)
PART B (Lists)
-
lookAndSay(a) [10 pts]
First, read about look-and-say numbers here. Then, write the function lookAndSay(a) that takes a list of numbers and returns a list of numbers that results from "reading off" the initial list using the look-and-say method, using tuples for each (count, value) pair. For example:lookAndSay([]) == [] lookAndSay([1,1,1]) == [(3,1)] lookAndSay([-1,2,7]) == [(1,-1),(1,2),(1,7)] lookAndSay([3,3,8,-10,-10,-10]) == [(2,3),(1,8),(3,-10)]Hint: you'll want to keep track of the current number and how many times it has been seen. -
inverseLookAndSay(a) [10 pts]
Write the function inverseLookAndSay(a) that does the inverse of the previous problem, so that, in general:inverseLookAndSay(lookAndSay(a)) == aOr, in particular:inverseLookAndSay([(2,3),(1,8),(3,-10)]) == [3,3,8,-10,-10,-10]
maxProfit(prices) [15 pts]
Write the function
maxProfit(prices) which
takes a list prices
where prices[i] is the price of a given stock on the ith day.
You want to maximize your profit by choosing a single day to buy one stock and
choosing a different day in the future to sell it.
The function should return the maximum profit you can be achieved from any
buy-sell trade. If no profit can be achieved, the function should return 0.
For example, maxProfit([7,1,5,3,6,4]) returns 5 because the best
possible trade is to buy on day 1 (price = 1) and sell on day 4 (price = 6),
thus the maximum profit is 6-1 = 5. Note that buying on day 1 and selling on day
0 is not allowed because you must buy before you sell.
maxProfit([4,3,2,1]) should return 0 because the stock prices are
declining and any buy-sell trade would generate losses.