
Internal fMRI Fastmap Experiments Page
This page is for internal use by members of this project only.
Experiment Description
The experiments described here utilized the
Fastmap
utility from Professor
Christos Faloutsos. This
code implements a fast multi-dimension scaling algorithm. It is able
to project a high dimensional data set into a low dimensional space
such that the distance between individual data points in the low
dimensional space is as close as possible to what it was in the original high
dimensional space. This can be useful for visualizing large high
dimensional data sets as well as accelerating certain types of processing.
In these experiments it was used as an aid to visualization.
As per Christos' suggestion, a new data set was generated from the original
fMRI voxel data such that each point in the new data set contained all of
the values for a single voxel over a single trial. Specifically, if 100 voxels
were being examined in a trial with 15 times slices, the new data set
would contain 100 data points each with 15 values - a 15 dimensional data set.
This new data set was presented to fastmap and it would map it to a lower
dimensional space.
I tried mapping down to two and three dimensional spaces, but the
results did not seem meaningful for this data set. So I tried mapping
to a one dimensional space. The result is that only one value per
voxel is generated by fastmap and these values can be visualized as an
image. This mapping is such that voxels with similar trajectories
through time will be mapped to similar values. If these values are
visualized using a "spectrum" color map, then voxels with similar
colors are the ones that have similar activations over time. The
actual value (color) is not important, just the relationship between
voxels. The result is an image which can be visually used to identify
clusters in the data without committing to a specific number of
clusters and using a standard clustering algorithm.
It was decided to try normalizing the data before using fastmap. Two
possibilities were explored: zero mean only normalization and both
zero mean and unit variance normalization. In both cases the data for
each voxel was normalized independently and the normalization
calculations only included the data from that trial.
Results
Following this section are example images as well as links to the full
data set. In each case the image plots a subset of "interesting"
voxels values from a single trial. The following is the file naming
code is what has been used before on this project.
Name breakdown for the file "02882_lb_i525_c05_n17.031":
| Part | Description |
| 02882 | subject number |
| lb | brain area (lb = left broca, lt = left temporal) |
| i525 | original image index (time) of the first image in this subsequence |
| c05 | experimental condition |
| n17 | number of images in this subsequence |
| .031 | index of the trial for this subject (begins with trial 000) |
The experimental codes are as before and are as follows:
| Code | Description |
| 0 | bad data - ignore |
| 1 | fixation |
| 2 | PP preferred |
| 3 | PP unpreferred |
| 4 | RRC preferred |
| 5 | RRC unpreferred |
| 6 | blocked RR pref (ignore) |
| 7 | blocked RR pref (ignore) |
I believe the results are interesting. Even though only a single
trial is presented here as an example, the relationship between voxels
seems to be stable across trials and is also stable for the fixation
trial. Someome who is familiar with the anatomy may find something useful
in these images.
Because fastmap does not have a problem handling this amount of data, I also
performed experiments which included the region of interest voxels. This
is the full block of pixels manually marked as LB or LT, not just the ones
which passed the t-test. I also tried the full brain data from one trial.
The resutls from the full brain data do not seem conclusive, because the
color mapping used is not good for differentiating many finely spaced values.
A single trial from each of the experiments is included as a trial on this page
as well as a link to the full directory of images.
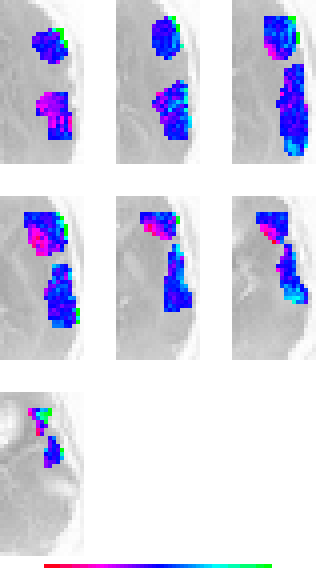
Example Images

above image name = 02882/lb/02882_lb_i021_c04_n17.001.fm1_t000.gif
brain area = LB, experimental condition = 4, more LB images

above image name = 02882/lt/02882_lt_i021_c04_n17.001.fm1_t000.gif
brain area = LT, experimental condition = 4, more LT images


above left image name = 02882/lblt/02882_lblt_i021_c04_n17.001.fm1_t000.gif - raw data
above mid image name = 02882/lblt_nmean/02882_lblt_i021_c04_n17.001.fm1_t000.gif - normalized to zero mean only
above right image name = 02882/lblt_norm/02882_lblt_i021_c04_n17.001.fm1_t000.gif - normalized to zero mean and unit variance
brain areas = LB & LT, experimental condition = 4
more LBLT images of raw data
more LBLT images of mean only norm data - a page with all LBLT images grouped by condition
more LBLT images of full norm data - a page with all LBLT images grouped by condition

above image name = 02882/lb_roi/02882_lb_i021_c04_n17.001.fm1_t000.gif
brain area = LB ROI, experimental condition = 4, more LB ROI images

above image name = 02882/lt_roi/02882_lt_i021_c04_n17.001.fm1_t000.gif
brain area = LT ROI, experimental condition = 4, more LT ROI images


(if you make the window wide enough, all images will be on the same line)
above left image name = 02882/lblt_roi/02882_lblt_i021_c04_n17.001.fm1_t000.gif- raw data
above mid image name = 02882/lblt_nmean_roi/02882_lblt_i021_c04_n17.001.fm1_t000.gif - normalized to zero mean only
above right image name = 02882/lblt_norm_roi/02882_lblt_i021_c04_n17.001.fm1_t000.gif - normalized to zero mean and unit variance
brain area = LB & LR ROI, experimental condition = 4
more LBLT ROI images of raw data
more LBLT ROI images of mean only norm data - a page with all LBLT ROI images grouped by condition
more LBLT ROI images of full norm data - a page with all LBLT ROI images grouped by condition


above left image name = 02882/lblt-all-nmfm1.gif
this is the LBLT ROI data, normalized to zero mean only, includes the entire time series


(if you make the window wide enough, both images will be on the same line)
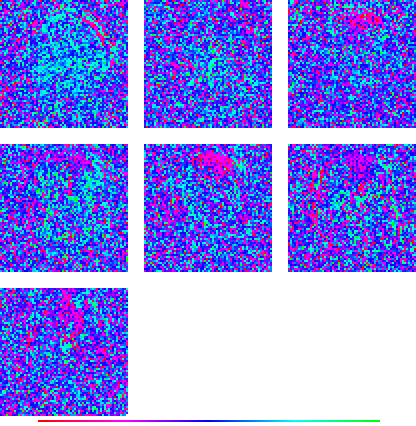
above left image name = full-fm1_t000.gif
source data = 02882_full_i372_c05_n16.022.fm1, raw data
brain area = FULL, experimental condition = 5

(if you make the window wide enough, both images will be on the same line)
above left image name = full-nmfm1_t000.gif
source data = 02882_full_i372_c05_n16.022.nmfm1, normalized to zero mean only
brain area = FULL, experimental condition = 5
(if you make the window wide enough, both images will be on the same line)
above left image name = full-nfm1_t000.gif
source data = 02882_full_i372_c05_n16.022.nfm1, normalized to zero mean and unit variance
brain area = FULL, experimental condition = 5
above image name = 02882_mean_inv.gif
source data = simple mean (no fastmap processing) of all brain images for subject 02882
brain area = FULL, experimental conditions = all
Last updated 3/11/99 by Chuck