
Proposing font detection then font-specific recognition causes a separate set of problems. Accurate font detection is difficult as small variations on a font often occur, which in Western typesetting would be considered a separate font. However, because of the size of the character set, it is not feasible to store separately all the variations a single font family may have. As we will show later, omnifont recognition seems to be a viable method of classification.
Finally, because of the complexity of the entire Chinese character set, our work uses a large set of features. Because of the size of the entire feature vector, heuristics and optimizations are needed to effectively prune it down to a more manageable size, pointing to the need for some type of feature selection or combination.
Our previous work, described in [Romero et al. 95,] consisted of two main pieces: statistical analysis of the features to create a nearest-neighbor classifier, and an additional post-processing step of neural network training. The statistical analysis was performed on a collection of 37,000 characters in the songti font, scanned from Chinese texts and subsequently ground-truthed. Based on these measurements, multiple discriminant analysis was performed to combine all of the features into a reduced-dimension space while scaling the dimensions to uniform within-class variance. Applying the discriminant transform to a set of reference characters rendered from a TrueType font generated the class means for the nearest neighbor classifier.
Additionally, we applied two methods of neural network training, LVQ (Learning Vector Quantization) and DSM (Decision Surface Mapping,) to further modify the nearest neighbor classifier. The training was performed using a subset of the ground-truthed character data. In those tests, the LVQ training resulted in the better performance.
We have since advanced this work, using distortion modeled data to create omnifont recognition capabilities. By using distortion modeled data, we also lessen the impact seen when characters with low occurrence rates need to be classified. From our set of 39,644 ground-truthed characters, only 1948 unique characters were represented, and 463 characters appear exactly once. The total font size is 6992 characters.(1) In another study of character frequency [Xiandai 86], a collection of 1.8 million characters contained 4574 unique characters, 425 of which occurred only once. By using distortion modeling, we can generate exemplars of all of the characters.
In addition, we have extended our work to provide probability measures on the result of a classification. Previously, using forms of nearest neighbor classification, there was no absolute measure of confidence which could be extracted from the classification results. We have implemented a new method of training and classification using PNN's (Probabilistic Neural Networks) to directly model the probability distributions of the individual character classes.
(EQ 1) In this equation, (EQ 2) (EQ 3) (EQ 4) (EQ 5) (EQ 6) Equation 2 computes the class means based on the set of exemplars. Both the within-class scatter (EQ 7) (EQ 8) (EQ 9) (EQ 10) (EQ 11) (EQ 12) And it follows from this that
(EQ 13) (EQ 14) Taking the determinant of a scatter matrix is equivalent to finding the product of the eigenvalues, which corresponds to the product of the variances. Looking back at Equation 1, by maximizing this ratio, we are looking for a transform (EQ 15) where the vectors In addition, the individual dimensions of the discriminant space created by each eigenvector One additional step can be taken to scale all the within-class variances to uniform size in the discriminant space. The variance in dimension (EQ 16) and each dimension can be scaled by replacing (EQ 17) giving each new dimension uniform variance. This should be done if the classifier being used does not account for differing variances between dimensions, as is the case in DSM and LVQ.
The computation of the discriminant transform was obtained by first computing All that remains is a straightforward calculation of the eigenvalues and eigenvectors. The transformation matrix is formed with eigenvectors in the order of their increasing eigenvalues. To obtain an initial set of class means, compute
In our past experience with classification using the DSM (Decision Surface Mapping [Geva and Sitte 91]) and LVQ (Learning Vector Quantization [Kohonen 88]) algorithms, we found the lack of a confidence measure on classification results somewhat disconcerting. The result of the classification in these systems is a distance measure between an exemplar and a class, which provides an ordering for the results, but the actual distance is of little use for computing confidence measures.
As a result, we have chosen to implement a PNN (Probabilistic Neural Network [Specht 88]) classifier. The PNN implementation attempts to model the actual probability distributions of classes with mixtures of Gaussians, allowing the computation of the posterior probability associated with each exemplar classification.
Standard PNN methods require the storage of all of the exemplars in order to compute the final probability of class membership. Instead, we have used Mixture Gaussian PNN's [Streit and Luginbuhl 94] which create probability distributions using a fixed number of Gaussian components. The resulting distribution formed through Generalized Fisher iterative training is the local maximum likelihood estimate for the class. Appendix B contains a short description of the training algorithm. See [Streit and Luginbuhl 94] for details, discussion, and a derivation.
The training computes three sets of values: the means for the components of each class, the mixing proportions to use for the individual components, and the final within-class covariance matrix. We will let where We assume that the costs associated with choosing any of the characters incorrectly is the same. By choosing the class with the highest-valued probability density function, the Bayes minimum risk decision can be made. Alternatively, a priori character occurrence probabilities can be embedded into this system. The ability to improve classification, though, is dependent on the character occurrence rates for the particular document set. If the rates embedded into the classification system do not correlate well with the observed character occurrences, recognition results could be hindered.
Examining Equation 19 shows that in order to compute the probability density function of an exemplar belonging to a single class, a vector-matrix multiply must be computed. The dimension of the matrix One simple proposal is to ignore all of the covariances as if they were zero and just consider the dimension variances. This may seem like a drastic measure, but on closer inspection, it has some credibility. When performing an initial multiple discriminant analysis step, one of the results is that the discriminant feature space is created using an orthogonal basis, the eigenvectors. As such, all within-class and between-class covariance is removed. However, that is with respect to the initial covariance matrices. The PNN Generalized Fisher training introduces a new set of covariance matrices based on classes made of Gaussian mixtures. The question is, how much covariance is introduced by this training.
Another method is to reduce the dimensionality of the feature vectors. Again, multiple discriminant analysis helps in performing this task by ordering the transformed dimensions based on their discriminant capacity. All that needs to be done is to pick the top Taking the cues up to this point, one should see that before any exemplar is given to the classifier, a vector-matrix multiply is applied to transform it into the discriminant space. It is feasible to modify the initial discriminant transform so that instead of orthogonalizing the initial within-class covariance, it orthogonalizes the feature space after PNN training occurs. In order to do this, we simply apply multiple discriminant analysis again to the covariance space generated from the PNN training.
This can be done by computing the eigenvectors and eigenvalues corresponding to the within-class covariance matrix, (EQ 20) (EQ 21) The generalized eigenvectors of (EQ 22) (EQ 23) The resulting Note that the initial transformation generated using MDA was based on covariance estimates using a single component mean. The final transformation is based on covariance estimates using more complex multiple-component distributions. However, any information loss generated in the first transformation will be propagated through the entire system. We currently have not examined the effects on performance which may be caused by this initial information loss. (See Section 6.5 for a discussion of the relevant results.)
Also note that the final post-processing MDA step does not affect classification performance. All of the information which was contained in the space before this step is retained. Specifically, the Mahalonobis distances, used in computing the probability density functions, are preserved. We have simply removed the existing covariances from the new space.
Lastly, an iterative pruning method can be used in conjunction with the above orthogonalization step. Since the dimensions of the final transform are ordered according to their discriminant capacity, one can use a small subset of the dimensions to form a candidate pool, then iteratively increase the number of dimensions to reduce the size of the candidate pool. While heuristic in nature, this optimization can be safely done if one avoids over-zealous candidate pruning.
Figure 3 Example of distortion effects on a single character in the songti font. All of our classification methods reported here used distortion modeling to generate sets of exemplars. The initial set of "clean" characters was generated by rendering scalable TrueType fonts into a The blurring and thinning effects are controlled by one parameter, the probability that a single (foreground) pixel will be blurred or thinned. A very high probability, ( The scaling effects are simulated by a virtual discretization of the full resolution bitmap into a lower resolution. The actual image size is not changed, but the effect is the same as first scaling the image down, applying an appropriate thresholding parameter, and then scaling the image back to the original size. The scale we used was We have tested the following sets of classification schemes, all of which resulted in omnifont classifiers:
The first three methods all used training data generated from a single set of distortion models. The models used blurring and scaling distortions combined in various ways to arrive at 16 different noise models. The models are summarized in Table 4. No thinning operations were done in these runs. The effects of the distortion can be seen in the images shown in Figure 3. The number of characters being used in the training set totaled 447,488, with 6992 characters per font and 64 exemplars per character class, generated using 16 noise models applied to each of the 4 fonts.
Another set of distortion models was used in dynamically training a full PNN model with covariances. The actual steps taken in this experiment differ from all other training methods in that all of the exemplars were dynamically generated. The set of distortion models for this run are given in Table 5. A summary for all the results is given in Table 6.
Using just multiple discriminant analysis, we generated three nearest-neighbor classifiers. Each classifier used the dimension reduction properties of multiple discriminant analysis to a varying degree. The transformation matrix was modified so that the final dimensions were all scaled to uniform variance. The final number of dimensions used was reduced from the initial feature size of 404 dimensions to each of 100, 150, and 200 dimensions. The classification results on the ground truth set is given in Table 6, rows one through three.
The difference between using 100 versus 200 dimensions in the resulting classifier is small, only about 0.15%. Note that the results obtained using just MDA are equivalent to LVQ with a single prototype per class and also to PNN with a single component per class. Using just this method, we obtain a very respectable 97% recognition rate using a 100 dimensional space.
For details on our version of the DSM algorithm, please refer to [Romero et al. 95]. We included a new feature in which additional components could be added to a class during the training phase. The modified DSM training algorithm was applied on the nearest-neighbor classifier of 100 dimensions generated with MDA. Our parameter settings were:
These parameters are fully described in [Romero et al. 95]. The classifier was presented each of the 447,104 distorted characters four times. The order of exemplar presentation was pseudo-random: first, the distortion model and font were randomly picked, then the ordering of the exemplars was permuted. Since each character class occurred only once per distortion model and font pair, all of the character classes will be presented exactly once before any of the character classes are repeated. The resulting classification performance is given in Table 6, row four.
The improvement in classification is quite good, considering the low level of additional overhead involved in classification. The results for the individual fonts are:
The modifications to the classifier during DSM training have a tendency to target the more troublesome areas of classification. By adding additional prototypes where needed, a significant improvement can be made with minimal costs. However, there is still the remaining problem of obtaining confidence intervals. One aspect of DSM training is that class prototypes are moved to form decision boundaries, not to model actual character distributions. Because of this, the prototypes tend to move towards the actual boundaries in order to make finer boundary modifications, rendering the distance information useless for computing confidence intervals.
We have also tested the PNN training algorithm while disregarding the covariance measures during classification, but not training, considering only the dimensional variances. For this test, we used two component means per class, for a total of 13,972 individual components. The training was performed in the first 100 dimensions of the discriminant space, which were not rescaled to uniform variance. The PNN training forms its own estimates of variances, making the re-scaling unnecessary. The training was allowed to run for 25 iterations through the data. The fourth row of Table 6 outlines these results. The results on a per-font basis are:
The results for the MDA and DSM algorithms are quite encouraging, however the PNN training using no covariance measures is surprisingly unspectacular. Using twice the number of component means, it performs slightly worse than using just multiple discriminant analysis alone.
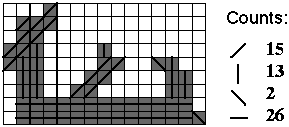
One possible explanation is that the aggregate affects of disregarding covariances is quite damaging. In examining this issue, we can look at the within-class correlation matrix obtained after the PNN classifier has been trained. The first 25 dimensions of the within-class correlation matrix are given in Figure 4. The dimensions have previously been ordered according to their discriminant capability, making the first 25 dimensions relatively more descriptive and relevant than later dimensions. Figure 4 seems to indicate that there is quite a bit of covariance information which we are throwing out.
Another possible problem, mentioned briefly before, is that the initial MDA step caused irreparable loss of some information which carried through to the PNN training. If this occurred, we could expect that the PNN classifier would perform only about as well as MDA techniques alone, even though it contained twice as many components per class.
It could also be the case that the training set is too small to accurately estimate the component means. For each class, we are using 64 exemplars to estimate two component means and their mixing proportions. The next test addresses this particular issue. The other objections raised will be considered in light of the additional results.
The final classifier we have built uses all of the covariance information throughout training, a dynamically generated set of exemplars, and an additional post-processing MDA step to create an orthogonal space. The set of distortion models used is given in Table 5. In this run, the following steps were done all using the same distortion models, but freshly generated data. Each set of distortion data consisted of 32 exemplars per class, 8 distortion models applied to 4 fonts:
The total number of exemplars generated for the entire process was over five million, 23 sets of 32 exemplars per class. For this classifier, we have increased the initial number of component means per class to 3. During training, some of these are pruned out because their mixing proportion becomes negligible, and the final classifier contained 20,885 component means. The results are shown in row 4 of Table 6. Again, performance is only slightly better than just MDA techniques alone, and still not as good as the DSM classifier. The total performance rate was 97.32, and the performance for the three fonts came out as:
Even more interesting, the performance of this classifier, which used all the covariance information, is only comparable to the previous classifier which completely ignored that information during classification.
As a final test of the importance of the covariances, this classifier was used to generate another model that disregarded the covariances. Instead of performing the final MDA step, the off-diagonals of the covariance matrix compute up to that point were set to zero, and the initial transformation matrix was kept intact.
The results for that run were in the last row of Table 6, with recognition rates of 97.04%. The breakdown is:
These rates are surprisingly comparable to what we obtained using the covariance information.
The most telling of all the results given above is the comparison between PNN classification with and without covariances. There is a possible confounding of factors here, since the distortion models and the number of component means changed. After examining these factors, it seems that the critical process is in the distortion modelling step.
It was mentioned earlier that there was some inevitable information loss when applying MDA to reduce dimensionality. This, however, can not be the sole cause of the problems seen when using PNN training. If it were, it could be remedied by not performing any dimension reduction. MDA can still be used to generate the discriminant functions, while keeping the full dimensionality of the feature vector without loss of information. We have attempted just this, applying PNN training on a non-reduced space, with no better performance than already reported.
One possible scenario which could side-step the initial loss is as follows:
In this process, no information loss is incurred until the final MDA step, and keeping around all information for PNN training may be beneficial. However, as was said in Section 4, classification performance is not affected by any additional MDA post-processing if all of the dimensions are retained. In order for this method to perform better than the other PNN methods, two things need to be true:
We have strong reason to believe that the first item is true, but the second item is more dubious. The reason for doubt is that the same distortion models are used throughout the entire process. Information deemed irrelevant with an initial MDA dimension-reduction will likely still be irrelevant after PNN training.
Further evidence of this comes when looking at the empirical within-class scatter matrix generated from the ground truth data, compared to the within-class scatter matrix computed on the distorted exemplars. We computed the within-class covariance matrix of the ground-truth data using all of the characters which had ten or more instances. The total number of character instances used was 35,899 out of a total 39,644 characters in our corpus.
We then computed the covariance as it would exist in the discriminant space using the same transformation matrix generated for creating the MDA classifier. If the covariance estimates from the distorted characters are accurate, the transformed covariance matrix should be nearly diagonal. Figure 5 shows the absolute values for the first 25 dimensions of the transformed, within-class correlation matrix with the diagonals removed. It is quite evident that we have not created an orthogonal basis for the true distribution of characters because of the prominence of correlations between dimensions.
Since the covariance estimates were inaccurate, PNN training hindered the final performance more than helping through trying to include the covariances as additional and useful information. This is further shown by the relative performance of the PNN classifiers with and without the use of the covariances. While somewhat disconcerting, these results do show us where work still needs to be done.
Given the available information, we have identified a crucial area which needs additional attention: distortion modeling. We believe that the greatest gain in recognition performance will come from additional work in creating more accurate distortion modelling techniques. In addition, we have shown methods which can be used to verify a distortion set's validity.
We have developed and demonstrated several classification models for Chinese character recognition. In addition, we have generated a large corpus of ground truth data used for classification verification. Of our existing implementations, the best recognition performance was attained using multiple discriminant analysis combined with decision surface mapping post-processing. However, this system does not provide estimates for posterior probabilities on the classification results.
We have developed a class of recognition methods that utilize both multiple discriminant analysis and probabilistic neural networks. In addition, we have presented methods of improving the classification speed without loss of precision. We have shown a viable method for an omnifont Chinese character recognition scheme that allows posterior probabilities to be computed on the classification results. What remains to be done is an extensive examination of iterative pruning methods to further increase classification speed.
To compute the average stroke width, three bitmap masks are convolved with the image:
Each match in the image with at least one of these masks counts as a single hit. A single location in the image that matches multiple masks is only counted once. If Notice that if there are no hits, then the stroke width is one. If there are half as many hits as foreground pixels, the stroke width is two. The result is a single valued feature of dimension one.
An estimate for the total stroke length can be obtained by taking the number of foreground pixels, Two histograms are computed, one horizontal and one vertical. Each histogram is a feature vector of dimension Similar to the histograms, transitions are computed along horizontal and vertical scan-lines. The value for scan-line Peripheral features are computed on an image sub-divided into "stripes" in both the horizontal and vertical directions. The first order peripheral feature for a particular stripe is the distance from the edge of the strip to the first background to foreground transition. The second order peripheral feature is the distance from the edge of the strip to the closest second background to foreground transition along a single scan-line.
The second order peripheral feature is not necessarily the second transition in the stripe. Instead, we look for the second transition within a scan-line and report the closest of these within each stripe. Below is an example of the first and second order peripheral features in the "East" direction.
First and second order peripheral features are computed for each of the four main directions, North, South, East and West. The image is divided into eight stripes. This results in 32-dimensional features for both first and second order peripheral features.
To compute stroke density, first divide the image into eight stripes for both horizontal and vertical directions. Within each stripe, count the number of background to foreground transitions. The result is a 16-dimensional feature.
Local direction contributivity locally measures the size of strokes in the four major orientations. For each foreground pixel, we compute the length of four lines that pass through the pixel, one for each of The image is then divided into regions using a four-by-four grid. For each region, the average length of the lines for each of the four orientations is computed. This results in a 64-dimensional feature.
Stroke proportion is a proportional measure of stroke directions. To start, for each foreground pixel, determine the orientation of the longest continuous line of foreground pixels that passes through this pixel. Orientations are limited to The image is divided into four stripes for both horizontal and vertical directions. Within each stripe, the fraction of pixels labeled with each orientation is computed. For the above stripe, with a total of 56 foreground pixels, the stroke proportions would be:
Each of these is reported for a single stripe, and there are four horizontal and four vertical stripes, resulting in a 32-dimensional feature.
This feature is closely related to local direction contributivity and stroke proportion. Each foreground pixel is assigned an orientation based on the same computation as in stroke proportion. The image is divided into a grid as in local direction contributivity. Within each block, report the number of foreground pixels which belong to each orientation. The result is a 64-dimensional feature.
This feature treats an image as a single long vector instead of a two-dimensional object. The transformation into a single vector is done four separate ways to represent the four orientations. Below is an image of how an image would be transformed into a vector for the Each long vector is then sub-divided into Training for the maximum likelihood probabilistic neural network is achieved through the following steps. First, initial estimates are made for the component means, Mixing proportions, (EQ 24)
For our work, we began training with For PNN training iteration (EQ 25)
Then, we update the mixing proportions using:
(EQ 26) And the new component means are:
The new covariance matrix is estimated as:
(EQ 28)
Care needs to be taken at some points of this computation. For instance, it is possible for one of the mixing proportions, 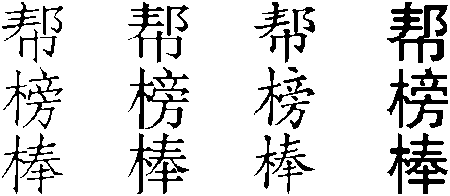
1.2 Previous Work
The backbone of this work is the actual features which are computed on the characters. The features which we use were originally developed specifically for printed Chinese texts. The most complete description of the entire feature set can be found in [Suchenwirth et al. 89,] a study done by the Institutes of Measurement and Control Techniques, Communications, and Linguistics at the Technical University of Berlin. Their work includes a survey of Chinese character recognition methods and their relative performance. A table of the feature types and their sizes is given in Table 1, and Appendix A describes all of the features in more detail. These features are computed on a normalized  image.

--------------------------------------------------------------------------------
Name Dimensions
-------------------------------------------------------------------------------
   Font     Characters   Unique Characters   Number of Source    Number of Source
                                                 Pages            Documents
-------------------------------------------------------------------------------
songti          37 021              1 850                 68                 13
kaiti            1 816                500                  2                  1
fangsongti         807                357                  5                  1
-------------------------------------------------------------------------------
1.3 Ground Truth Data
We have generated a set of ground truth data from various printed sources that represent characters in three fonts: songti, fangsongti, and kaiti. The one font we do not have represented is heiti, which is a "headline" style font. Of these fonts, the distribution of characters and sources is given in Table 2. The vast majority of characters are from the songti font. The document quality and font sizes vary widely between the various sources. The document set was selected as a representative sample of publications one could expect to see from the People's Republic of China by a native of the country.
1.4 Current Work
The previous tests were all done on a single font and the scanned data was used in all of the steps when creating the classifier. By not performing font detection, one potential source of error has been omitted. By using our scanned data to create the classifier, our results were optimistically biased. It is unclear how much of a factor either of these omissions comes in to play, but the downward impact on the generalizing capability of the resulting classifier is assured.
2 Discriminant Transformation
2.1 Multiple Discriminant Analysis
By computing the features outlined in Table 1 and described in Appendix A, we can apply multiple discriminant analysis (MDA) techniques to create a nearest-neighbor, omnifont classifier. A brief summary of the computations involved is given here, but for a full discussion see [Duda and Hart 73]. The goal of multiple discriminant analysis is to maximize

 is the between-class scatter matrix,
  is the within-class scatter matrix, and
  is the transformation we are searching for in order to form the optimal discriminant space. We can define the following, with
  being the set of exemplars in class
  , and
, and  a feature vector for a particular exemplar:


 and the between-class scatter
  are analogous to their respective covariance matrices. In looking for
  we can define:


 that maximizes the between-class variance with respect to the within-class variance. The solution of Equation 1 can be shown to correspond to the generalized eigenvectors of the equation:

 then form the columns of the matrix
  .
.
 are now ordered. The between-class variance in dimension
  is proportional to the eigenvalue
  .
Assuming a constant within-class variance, the higher the between-class variance of a dimension, the better discriminant capacity of that dimension. This fact will aid later in improving classification speed.
.
Assuming a constant within-class variance, the higher the between-class variance of a dimension, the better discriminant capacity of that dimension. This fact will aid later in improving classification speed.
 can be computed as:

 with
with

2.2 Computation
 ,
,  , and
, and  based on the features from all of the distortion modeled characters. However, because some of the feature elements are linearly dependent on other features,
  and
and  are not of full rank, and the linearly dependent dimensions need to be removed. To determine these dependencies, the correlation matrix was computed from the total covariance matrix,
  .
Linear dependence between dimensions can be determined using variance inflation factors, the diagonals of the inverse correlation matrix. A high variance inflation factor signifies that a particular dimension is a linear combination of others. (For a discussion on variance inflation factors, see [Myers 90] or another statistical textbook on regression.) Dimensions are iteratively removed, always removing the dimension with the highest variance inflation factor, until the maximum variance inflation falls below a threshold. Using a threshold of 1000, we removed 9 dimensions, for a total feature vector of 395 dimensions.
.
Linear dependence between dimensions can be determined using variance inflation factors, the diagonals of the inverse correlation matrix. A high variance inflation factor signifies that a particular dimension is a linear combination of others. (For a discussion on variance inflation factors, see [Myers 90] or another statistical textbook on regression.) Dimensions are iteratively removed, always removing the dimension with the highest variance inflation factor, until the maximum variance inflation falls below a threshold. Using a threshold of 1000, we removed 9 dimensions, for a total feature vector of 395 dimensions.
 as shown in Equation 9.
3 Probabilistic Neural Networks
 be the
  th component mean for class
  ,
,  be its mixing proportion, and
  be the final within-class covariance matrix.
Then, the probability density function associated with classifying exemplar
be the final within-class covariance matrix.
Then, the probability density function associated with classifying exemplar  as a member of class
  is given by:

 is the number of Gaussian components used to model class
  and
and  is defined as:


4 Classification Modifications
 is
is  , where
  is the dimension of the feature vector.
Considering the size of the initial feature vector at about 400 dimensions, this vector-matrix multiply is a serious bottleneck in computation. With two Gaussian components per character class, it would take approximately 320,000 multiply-adds to compute a single
is the dimension of the feature vector.
Considering the size of the initial feature vector at about 400 dimensions, this vector-matrix multiply is a serious bottleneck in computation. With two Gaussian components per character class, it would take approximately 320,000 multiply-adds to compute a single  , and over 2 billion multiply-adds to classify a single character.
 eigenvectors which will make up the columns of the transformation matrix. We used this method in [Romero et al. 95] when doing just a single font. This step can done before PNN training takes place. However, choosing a reasonably sized
  of 100, classifying a single character still requires a very large number of floating point computations. With two component means per class, approximately 140 million multiply-adds would be required for each classification.
 in Equation 19, and the new between-class covariance matrix,
  .
.  can be computed as follows:


 and
and  can be used to create the transform matrix
  as before, and we have:


 will be a diagonal matrix and the vector-matrix multiply is now an
  operation instead of
  . The exemplar's feature vector must still have a transform applied to it, but this is only done once. The vector-matrix multiply in Equation 19 is done for every component of every character class. Using
  equal to 100 and using two components per class, we now have an initial vector-matrix multiply of about 40,000 multiply-add's to compute the transformed exemplar, then an additional 1.4 million multiply-adds to compute the probability density functions.


5 Distortion Modeling
 bitmap, using all of the songti, fangsongti, kaiti, and heiti simplified variations. The distortion program we used was originally developed by Mitek Systems, Inc. While the program offers additional types of noise effects, we used it to generate blurring and scaling effects. We augmented their distortion types to also perform thinning. Table 3 describes the types of distortion and their parameters.
 ,) of blurring causes a uniform thickening of the image. A moderate probability,
  ,) causes the edges to become increasingly jagged with each iteration. Low probabilities, (
 ,) cause fine distortions around the edges of the character.
 , making the
  bitmaps appear as if they were scaled up from a
  bitmap. Thresholding was done at three different levels of 1, 2, and 3 pixels out of a possible 4.
------------------------------------------------------------------
Command Description
(b p) Blur foreground pixels with probability p
(s d) Scale apparent resolution 50%, using d foreground pixels
as the threshold. (1 <= d <= 4)
(t p) Thin foreground pixels with probability p. (Blur the
inverse image.)
------------------------------------------------------------------
------------------------------------------------------------------------
Lists of Distortions Applied
((b 0.99) (b 0.05) (b 0.05)) ((b 0.05) (b 0.05))
((b 0.2) (b 0.2)) ((b 0.99) (b 0.2) (b 0.2) (s 3))
((b 0.05)) ((b 0.2))
((b 0.1)) ((s 1) (b 0.25) (b 0.25) (s 2) (b 0.05))
((b 0.99) (b 0.99) (b 0.05) (b 0.05) ((b 0.99) (b 0.99) (b 0.2) (b 0.05) (b 0.05))
((b 0.99) (b 0.2) (b 0.1) (b 0.1) ((s 2) (b 0.2) (b 0.1) (b 0.1)
(b 0.05) (b 0.05) (s 3)) (b 0.05) (s 3))
((b 0.99) (b 0.2) (b 0.1) (b 0.1) ((b 0.99) (b 0.4) (b 0.1) (b 0.1)
(b 0.05) (b 0.05) (s 2)) (b 0.05) (b 0.05) (s 2))
((b 0.99) (b 0.4) (s 2)) ((b 0.99) (b 0.4) (s 3) (b 0.125))
------------------------------------------------------------------------
-----------------------------------------------------------------------
Lists of Distortions Applied
((b 0.99) (b 0.05) (b 0.05)) ((t 0.5) (b 0.05))
((b 0.2) (b 0.2)) ((b 0.99) (t 0.2) (b 0.2) (s 3))
((b 0.9) (b 0.9) (t 0.2) (b 0.05)) ((b 0.05))
((s 1) (b 0.25) (b 0.25) (s 2) (t 0.05) ((b 0.9) (b 0.05) (t 0.7) (b 0.05))
-----------------------------------------------------------------------
6 Results
6.1 MDA Classifiers
6.2 DSM Classifier
 , the initial learning rate.
 , the linear decrease applied to the learning rate each epoch.
 , the threshold used to determine if a new component should be added to a class.
---------------------------------------------------------------
      Algorithm        Dimensions   Number of    Recognition Rate
                                   Components
---------------------------------------------------------------
         MDA               100          6 992        97.07
         MDA               150          6 992        97.13
         MDA               200          6 992        97.22
       MDA+DSM             100          7 026        97.61
       MDA+PNN             100         13 984        97.43
(without covariances)
     MDA+PNN+MDA           100         20 885        97.32
       MDA+PNN             100         20 885  97.04
(without covariances)
---------------------------------------------------------------
6.3 PNN Without Covariances

6.4 PNN with Covariances and Dynamic Distortion Models
6.5 Discussion
7 Summary
Appendix A : Description of the Feature Set
Stroke Width

 , blackness, is the number of foreground pixels, and
  is the number of hits, the average stroke width is then
  .
.
Total Stroke Length
 , divided by the average stroke width,
  . This can be simplified, substituting from the equation for average stroke width to
  .
.
Horizontal and Vertical Histograms
 . The value for the feature in dimension
  is the number of foreground pixels in row
  for horizontal histograms, or in column
  for vertical histograms.
Transitions
 is the number of transitions from background to foreground pixels. The feature value is the sum of all the transitions in the given direction, resulting in two values, one for the horizontal scan and one for vertical scan.
Peripheral Features

Stroke Density
Local Direction Contributivity
 ,
,  ,
,  , and
, and  .
The line segment spans only foreground pixels, giving it endpoints next to the furthest background pixel. An example of these four lines is given below:
.
The line segment spans only foreground pixels, giving it endpoints next to the furthest background pixel. An example of these four lines is given below:

Stroke Proportion
 ,
,  ,
,  , and
, and  .
The pixel is then labeled as a member of a stroke in that orientation. The figure below shows such a labeling for a sub-image.
.
The pixel is then labeled as a member of a stroke in that orientation. The figure below shows such a labeling for a sub-image.


Maximum Local Direction Contributivity
Black Jump Distribution in Balanced Subvectors
 and
and  orientations:

 sub-vectors each with approximately the same number of foreground pixels. Within each sub-vector, the number of background to foreground transitions is computed and divided by the total number of transitions for the entire vector. We used
  equal to 8, yielding a 32-dimensional feature.
Appendix B : PNN Training
 , the mean for class
  and component
  . This is done using a moving averages algorithm applied for each class. Initial estimates for components are randomly selected from the set of exemplar data. All exemplars are classified as members of their closest component. Then, each
  is recomputed as the mean of all exemplars which are members of this component. The algorithm stops iterating when no changes are made to any of the
  's.
's.
 , for each component are initially computed as the number of exemplars which are members of component
  divided by the total number of exemplars for class
  . Let
. Let  be the total number of classes,
  be the
  'th exemplar for class
  ,
,  be the number of components for class
  , and
, and  be the number of exemplars for class
  . The within-class covariance matrix is initially estimated using the following:


 and
and  , a constant number of exemplars and components means for all classes.
 , we start by computing the following:


 , to become small. In Equation 27, there is an implicit division by
  , which can cause problems if
  approaches zero. Our implementation checked for small
  , on the order of
  , and removed the corresponding component mean from that class. The assumption is that removing components that have little or no influence on the final computation for
  in Equation 18 is safe.
References
Footnotes

