Convergence Graphics
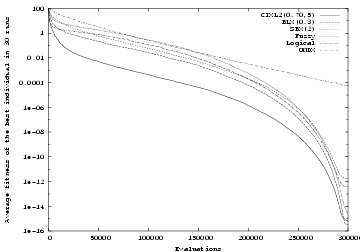
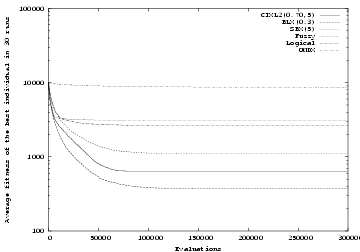
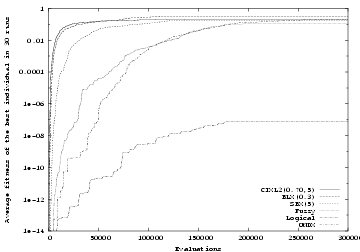
Figure 5:
Evolution of the average fitness, in logarithmic scale,
using different crossover operators for the function  .
.
|
|
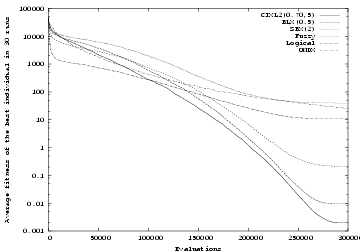
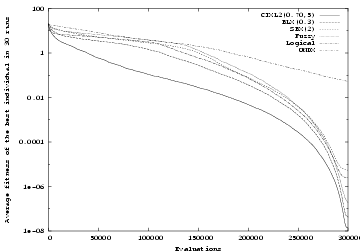
Figure 6:
Evolution of the average fitness, in logarithmic scale,
using different crossover operators for the function  .
.
|
|
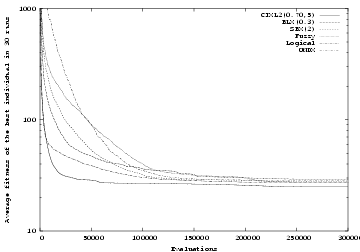
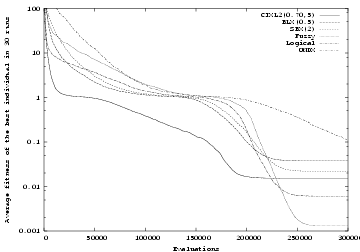
Figure 7:
Evolution of the averaged fitness, in logarithmic scale,
using different crossover operators for the function  .
.
|
|
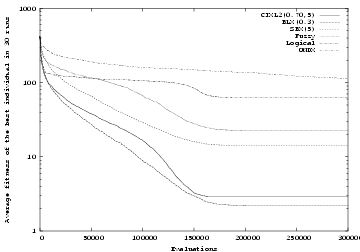
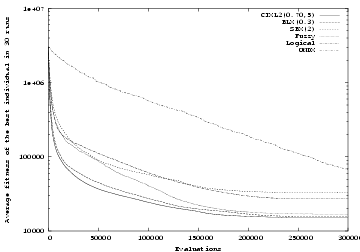
Figure 8:
Evolution of the average fitness, in logarithmic scale,
using different crossover operators for the function  .
.
|
|
Figure 9:
Evolution of the average fitness, in logarithmic scale,
using different crossover operators for the function  .
.
|
|
Figure 10:
Evolution of the average fitness, in logarithmic scale,
using different crossover operators for the function  .
.
|
|
Figure 11:
Evolution of the average fitness, in logarithmic scale,
using different crossover operators for the function  .
.
|
|
Figure 12:
Evolution of the average, in logarithmic scale,
using different crossover operators for the function  .
.
|
|
Figure 13:
Evolution of the average fitness, in logarithmic scale,
using different crossover operators for the function  .
.
|
|
Domingo
2005-07-11