CMU Quake Group
Ground Motion Animations and Images
TeraShake 1.3 - 1.0Hz 200m/s Simulation
SC06 HPC Analytics Challenge, Winning entry, November 2006
Model description
| Area covered: |
100 km x 100 km x 37.5 km |
| Magnitude: | Mw 6.7 |
| Maximum frequency: | 1.0 Hz |
| Damping: | Rayleigh |
| Min shear wave velocity: | 100 m/s |
| Points per wavelength: | 10 |
TeraShake 1.3 - 1.0Hz 200m/s Simulation
Surface animations
Hercules + CVM4
Selected points
Model description
| Area covered: |
600 km x 300 km x 80 km |
| Magnitude: | Mw 7.7 |
| Physical quantity: |
Displacements (m) at the free surface |
| Maximum frequency: | 1.0 Hz |
| Damping: | Rayleigh |
| Min shear wave velocity: | 200 m/s |
| Points per wavelength: | 6 |
| Delta Time: | 0.006 seconds |
| Total simulated time: | 180 seconds |
Run statistics - BigBen at PSC
|
| Total number of mesh elements: |
140.1 million |
| Total number of mesh nodes: |
147.3 million |
| Total number of processors: |
2048 |
| Total running time: |
54365.90 seconds |
(15 hrs 6 min 5.9 sec) |
| Meshing time: |
2322.14 seconds |
(38 min 42.1 sec) |
| Source construction time: |
1038.58 seconds |
(17 min 18.6 sec) |
| Solving time: |
50840.67 seconds |
(14 hrs 7 min 20.6 sec) |
| Other processes time: |
164.51 seconds |
(2 min 44.5 sec) |
| Solving-Time/step: |
1.69 seconds |
Credits: Animation created by Ricardo Taborda and Leonardo
Ramirez-Guzman CMU Quake
group, from a synthetic 1.0 Hz dataset generated by the CMU
Quake group, using the Hercules
tool chain (SC06), running at the
Pittsburgh Supercomputing Center.
TeraShake 1.3 - 0.5Hz 500m/s Simulation
Surface animations
Hercules + CVM3
Hercules + CVM4
Model description
| Area covered: |
600 km x 300 km x 80 km |
| Magnitude: | Mw 7.7 |
| Physical quantity: |
Displacements (m) at the free surface |
| Maximum frequency: | 0.5 Hz |
| Damping: | Rayleigh |
| Min shear wave velocity: | 500 m/s |
| Points per wavelength: | 8 |
| Delta Time: | 0.0125 seconds |
| Total simulated time: | 250 seconds |
Run statistics - BigBen at PSC
|
Hercules + CVM3 |
Hercules + CVM4 |
|---|
| Total number of mesh elements: |
82.3 million |
81.4 million |
| Total number of mesh nodes: |
84.5 million |
83.7 million |
| Total number of processors: |
1024 |
1024 |
| Total running time: |
15802.95 seconds (4 hrs 24 min) |
14110.41 seconds (3 hrs 55 min) |
| Meshing time: |
959.55 seconds (16 min) |
671.93 seconds (11 min) |
| Source construction time: |
3403.60 seconds (57 min) |
2802.72 seconds (47 min) |
| Solving time: |
11372.30 seconds (3 hrs 10 min) |
10567.02 seconds (2 hrs 56 min) |
| Time/step: |
0.79 seconds |
0.71 seconds |
Credits: Animation created by Ricardo Taborda and Leonardo
Ramirez-Guzman CMU Quake
group, from a synthetic 0.5 Hz dataset generated by the CMU
Quake group, using the Hercules
tool chain (SC06), running at the
Pittsburgh Supercomputing Center.
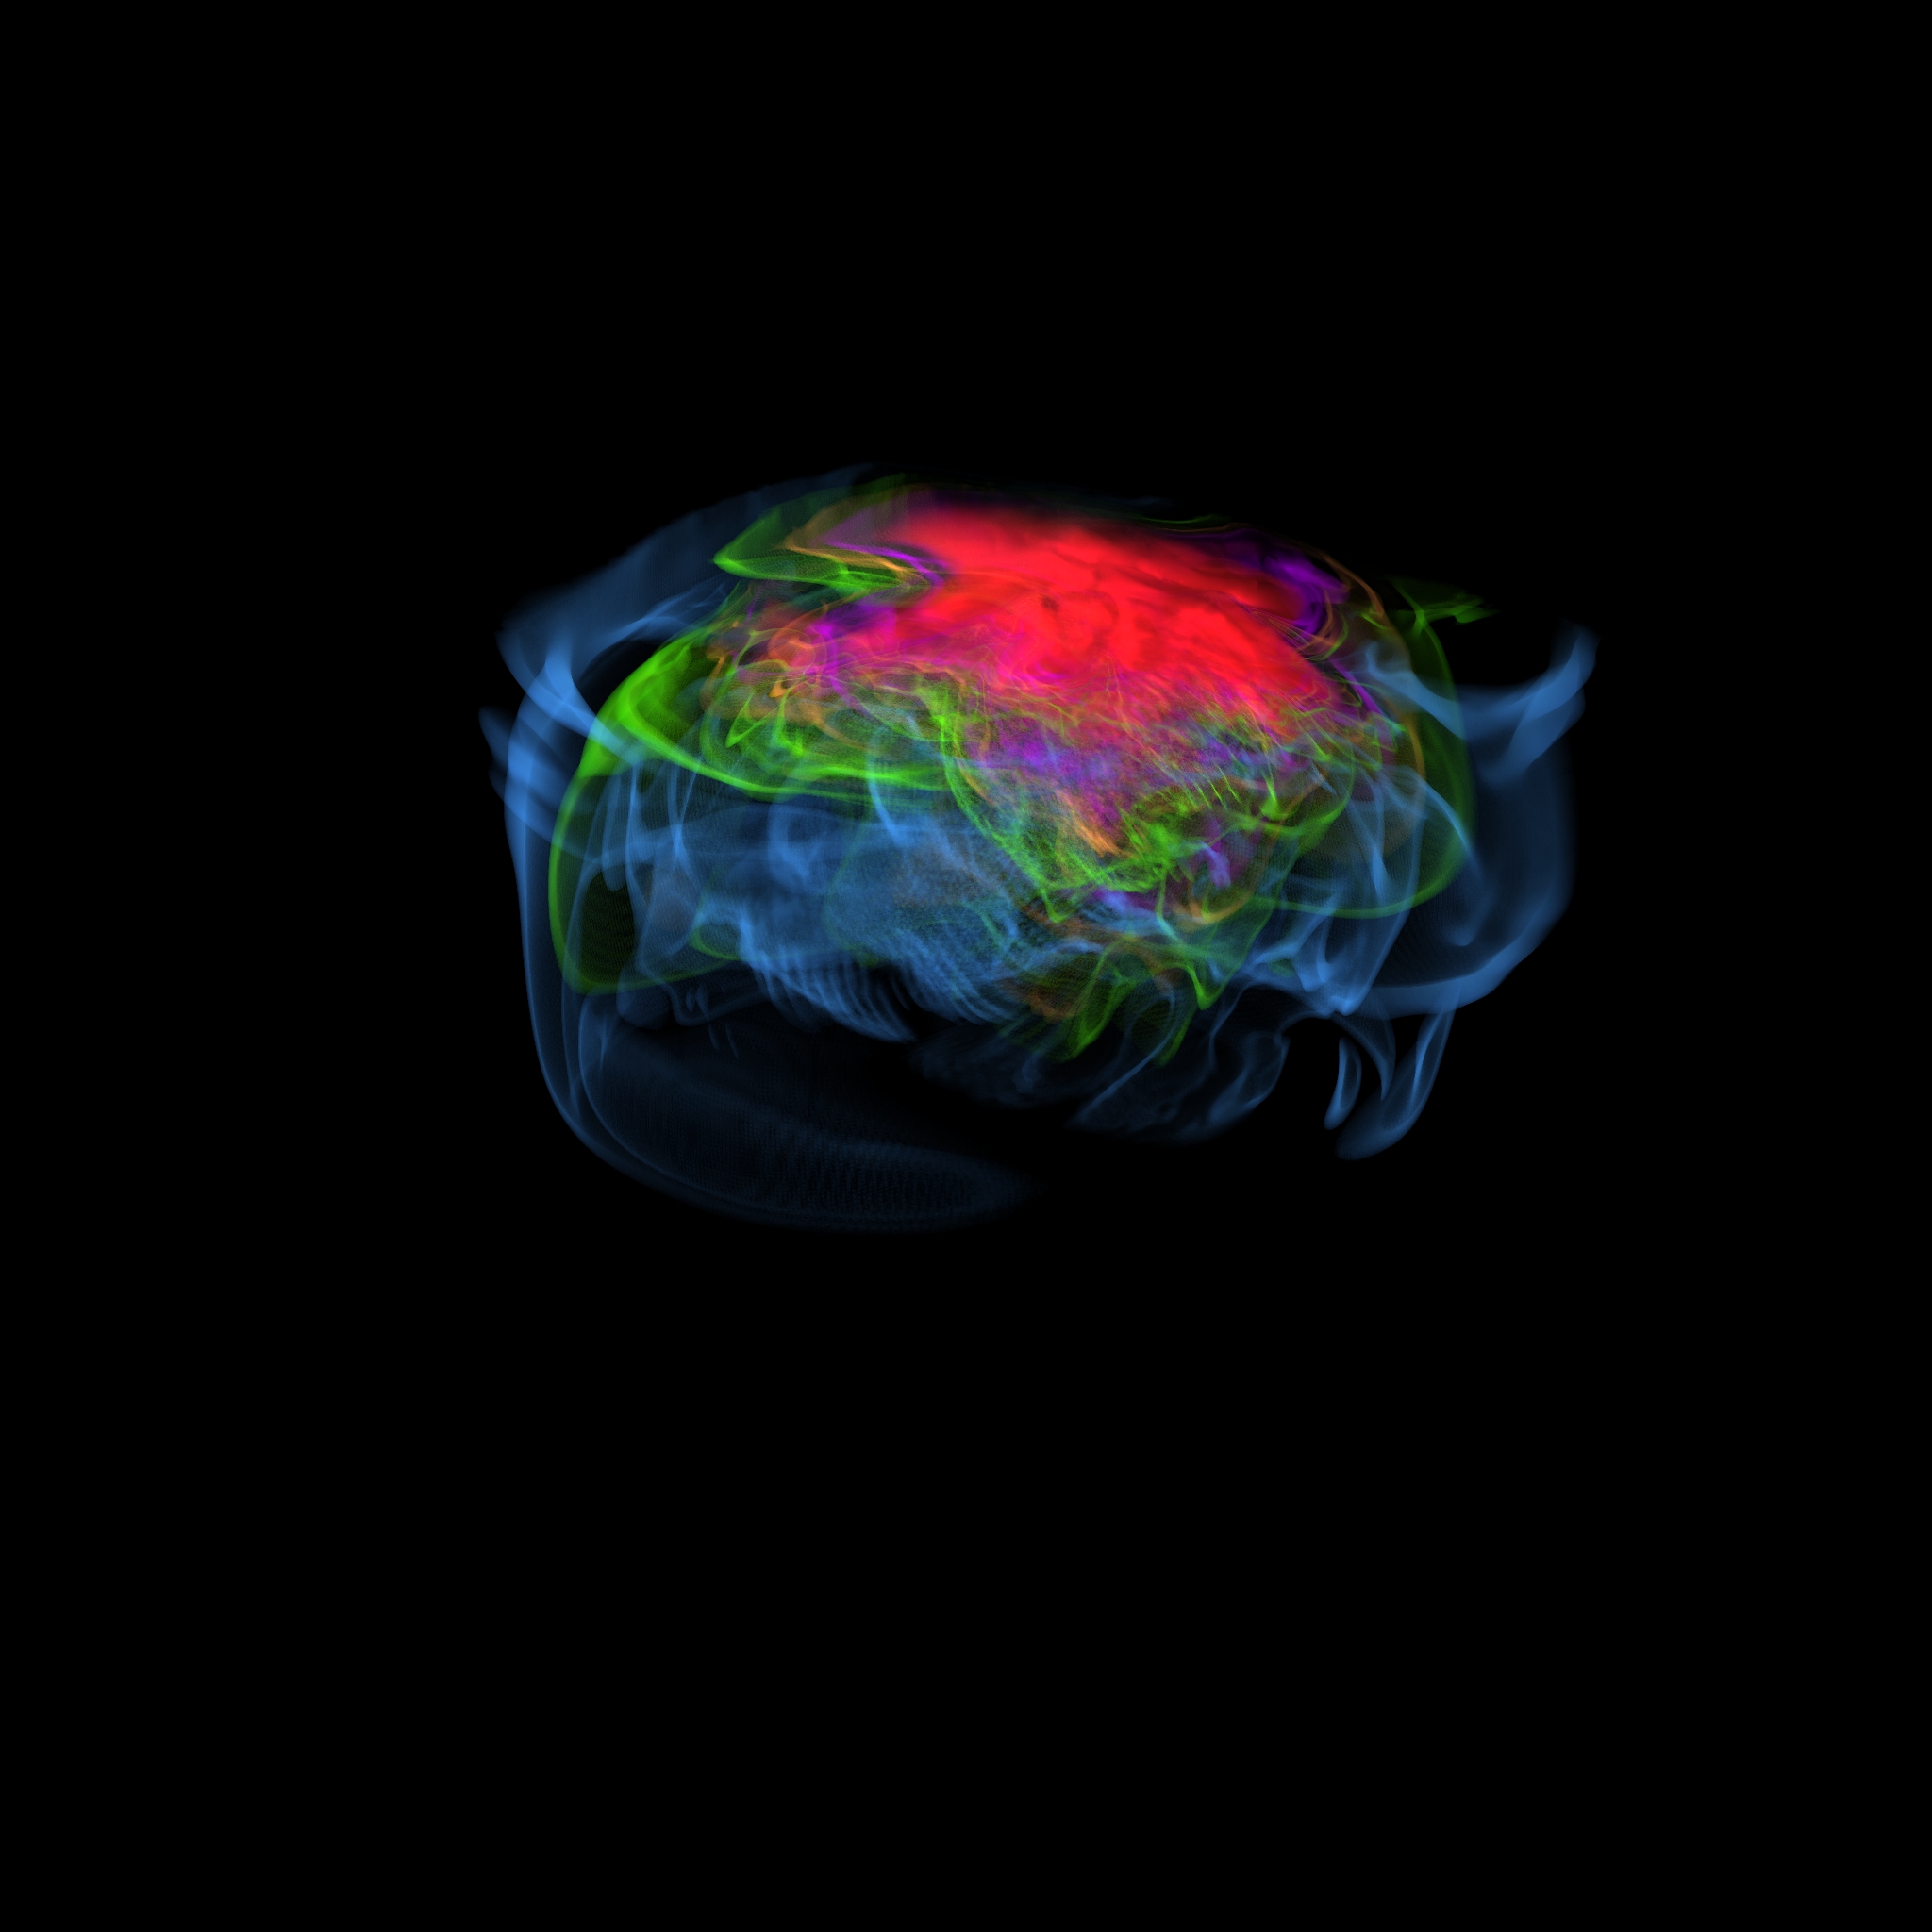
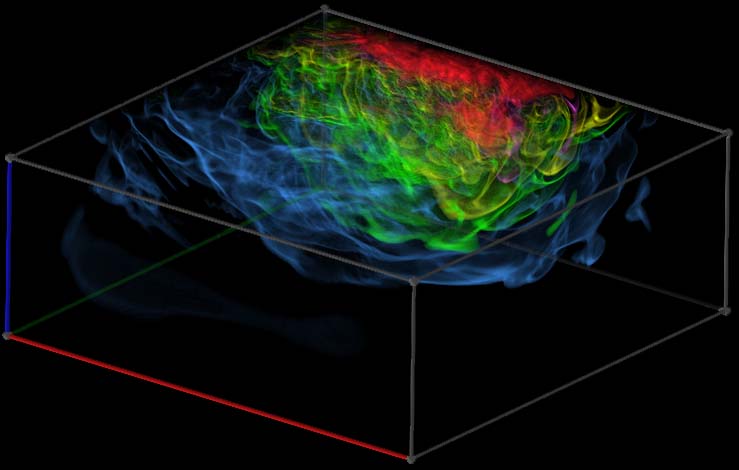
LA basin simulation
-
3D animation
- High-resolution images:
EPS image (1k x 1k),
JPEG image (1k x 1k),
JPEG image (2k x 2k),
- Image sequence:
50,
75,
100,
125,
150,
200,
250,
300,
350,
400,
-
Octree mesh (0.1 Hz)
Credits: Animations created by Hong Feng Yu and Kwan-Liu Ma, UC-Davis Visualization and
Graphics Research Group, from a synthetic 0.5 Hz wavefield dataset
generated by the CMU Quake
project, using the
Hercules tool chain (SC06), running at the
Pittsburgh Supercomputing Center.
1994 Northridge aftershock, San Fernando valley
Credits: Animations created by
Greg Foss,
Pittsburgh Supercomputing Center
and
CMU Quake group
from a synthetic 1 Hz wavefield dataset generated by the CMU Quake group
using the
Archimedes tool chain.
1995 Kobe mainshock
Credits: Animation created by
Greg Foss,
Pittsburgh Supercomputing Center
and
CMU Quake group using
synthetic wavefield data generated by the Yoshi Hisada, Kogakuin
University, Tokyo, Japan, and the CMU Quake group.