

In this final project, I attempted to implement the SIGGRAPH '01 paper on "Simulating Decorative Mosaics" by Alejo Hausner. Note: there is also a presentation on the paper.
Hausner's implementation advocates the use of graphics hardware z-buffer in order to approximate the voronoi diagram, which is essential to the techniques presented in his paper. However, this is not possible in matlab. As such, I used the concepts discussed that were essential for generating decorative tile mosaics and tried to generate the tile mosaics in matlab using methods that differed from his.
To simulate realistic-looking decorative tile mosaics, there are some points that are critical. First, we want a fair but random-looking distribution of titles so that gap between tiles is not too large. The squares should also be colored according to the part of the image it represented. We also, want the tiles to be oriented according to the edges (especially when they are near edges). Tiles should also not straddle edges so that the edges can be distinct, and the viewer can make out the outline of the image by looking at the color differentiation.
The first thing I tried to do in Matlab was to produce a Centroidal Voronoi Diagram (CVD) using Llyod's algorithm. Generating a Centroidal Voronoi Diagram allows us to know where to put the tiles. This is different from a mesh grid as the points are in random positions. However, Matlab's "voronoi" command does not return enough useful information about the voronoi points of the edges around the voronoi site. I then look at the voronoin command, but that gives points-at-infinity for unbounded region. I spent more than 6 hours looking for ways to solve the "points-at-infinity" problem before I decided to circumvent the problem by adding a buffer region of about 30 pixels around the image. I did not attempt to run Lloyd's algortihm for points in this buffer. I then removed the buffer region after running through around 50 iterations of Lloyd's algorithm. Generally, iterations above 20 produce good-looking uniformly distributed points.
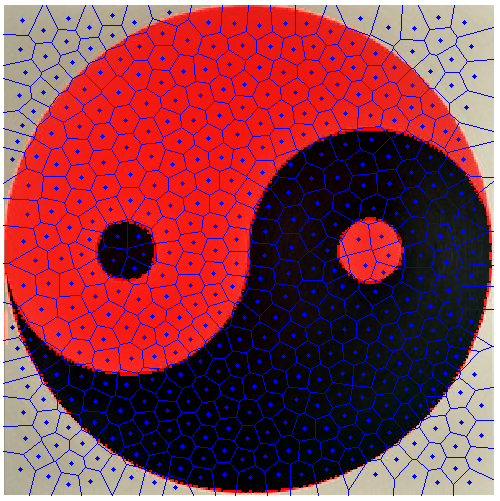
The first image shows a voronoi before and after running through Lloyd's algorithm. The second image is made up of 758 points after clipping the buffer.
Matlab's voronoin commands uses Euclidean distance metric instead of Manhattan distance metric as suggested in the paper. I could not find any Matlab packages on google that used the Manhattan metric.
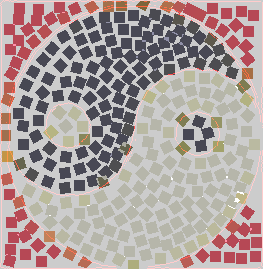
I first tried tiling without orientation to see what the output would be like. This is the image used in the paper.


In the above 2nd image, I had added a pixel border to each tile. I also use a grey background. I also let the tiles near the border of the image to appear "chipped off". Also, some of the tiles have overlaps.
The 2nd image above actually looks "nice", and the use of Euclidean distance metric is not an issue when the tiles are orientated at right angles.
We observe that finding the direction field is not as simple as taking the color gradient and the orientation of that color gradient. In the decorative mosaic, the tile orientation must emphasize boundary curves and follow the edge orientation if the point is near the edge. Hence, I first use the matlab edge function to get a binary image of the edges. Then I use bwdist the calculate the gradient of the line from a point to the closest point that is on an edge. I used the value of the gradient for tile rotation.


We observe that tiles on the edge line are not oriented and they straddle the edge. This problem can be solved by edge discrimination. In addition, the non-uniform orientation of tiles cause gaps between tiles to be bigger in some areas. The use of manhattan distance with orientation for voronoi diagrams will probably produce more better looking result.
Edge discrimination was difficult to implement, and it was very slow in Matlab. To implement edge discimination, I had to move the centroid point away from the edge when I generated the voronoi diagram. Hence, I checked whether the voronoi cell overlap with any the edge when calculating the new centroid, and only used non-overlap region for region calculation. In the event that an overlap disconnects the cell into two or more, I took the disconnected component where the centroid is in or if this is not possible, the region with the maximum area.
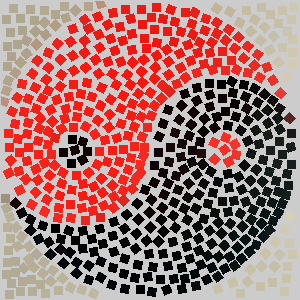
The 1st image below shows the result.
Compared with the earlier result, this is definitely much better looking.
The 2nd image below shows another run of the algorithm with a red line to show the edge used.
Note: in both images below, I have increased the size of the tile slightly and changed the background color to gray.

For the final result, I used about 30 iteraitions of Lloyd's algorithm to uniformly align the points, then I applied 20 iterations of the edge discrimation algorithm with Lloyd's algorithm. While the paper suggested the use Llyod's algorithm to re-center tiles to close up the gap after doing edge discrimination, I found that this did not work for me as my voronoi algorithm used euclidean metric and not the manhatthan metric with orientation.
I also found that using automated edge detection algorithm might not be the best solution as minor edge features might be detected and used in producing the tile mosaic. For instance, in the picture of Tux below, the stomach region of Tux has edge discrimination which appears weird on the mosaic. Having the user specify the edges by asking the user to highlight them (as suggested in the paper) might be a better idea.


I also added fake edge padding to ensure that the tiles near the 4 corners or 4 borders of the image get
oriented towards them.
The image used is from here.
In the 1st image below, the tiles at the 4 corners are oriented towards the circle, but in the 2nd image below,
the tiles are oriented towards the image border.
In the 3rd image, I added padding in my voronoi calculation and as a result, less tiles straddled the border of the image.
Note: some tiles may appear clustered here because a very low iteration number was used for Lloyd's algorithm to allow for faster processing.


Another problem I encountered when I ran my code on larger images was that there was large clustering near the edges. This was because I did not "block out" the edges region in the voronoi algorithm, or specifiy a convex hull of the new cell. This is unfortunately not possible with the matlab command. As such, while the centroid was no longer on the edge, the cell did not re-distribute itself after iterations of Lloyd's algorithm as shown in the 4th image below.
The 2nd image shows the clustering near the edges.
The 3rd image shows the result before edge avoidance, and the 4th image shows the result after edge avoidance is applied.
In the 2nd image, some parts of the mosaic has large gaps due to dual edge lines produced by the automatic edge algorithm.
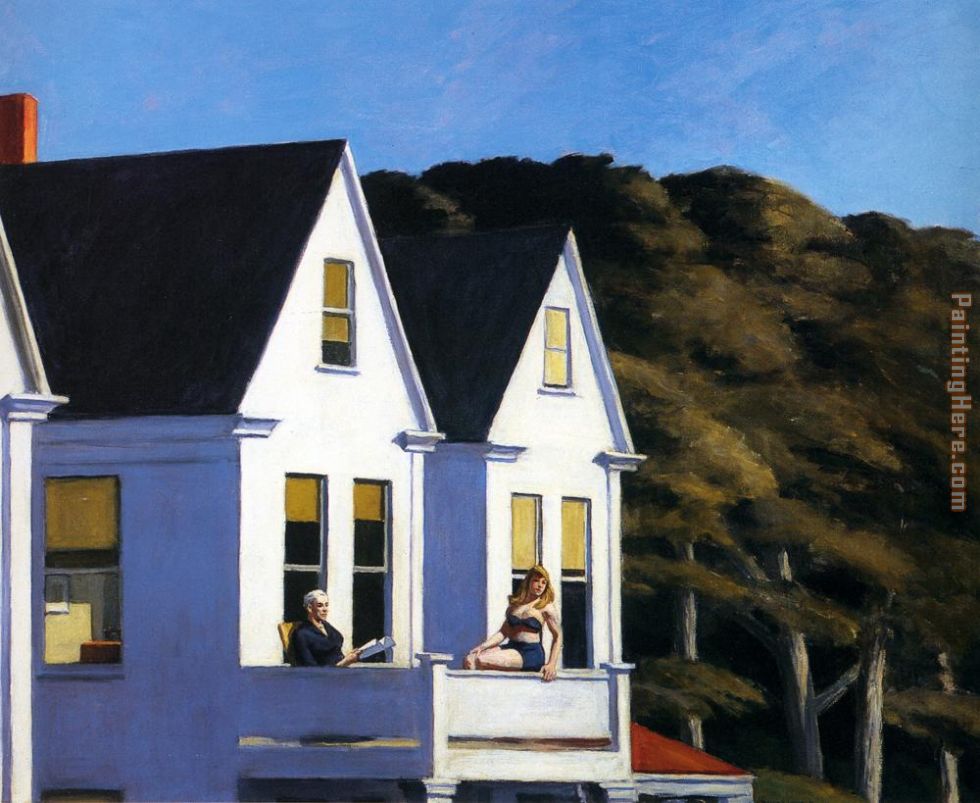
The image used is Edward Hopper's Second Story Sunlight Painting.


To couter the clustering problem due to my edge avoidance algorithm, I tried removing cells that there "too small" (e.g. area < 60, tile sizes are usually 9x9 or 10x10 or 11x11), but this had no significant improvement as such cells were few and far between.
I then decided to not include tiles that had more than X pixels overlaps. After some testing, I set X to 10, and this worked well.
Finally, I "corrected" the visual overlap problem by making the non-overlap wholesome and not "transparent" in the earlier mosaics. (This was because I simply added the squares onto the image instead of taking a mask). Hence, the overlaps would not result in coloring artifacts.
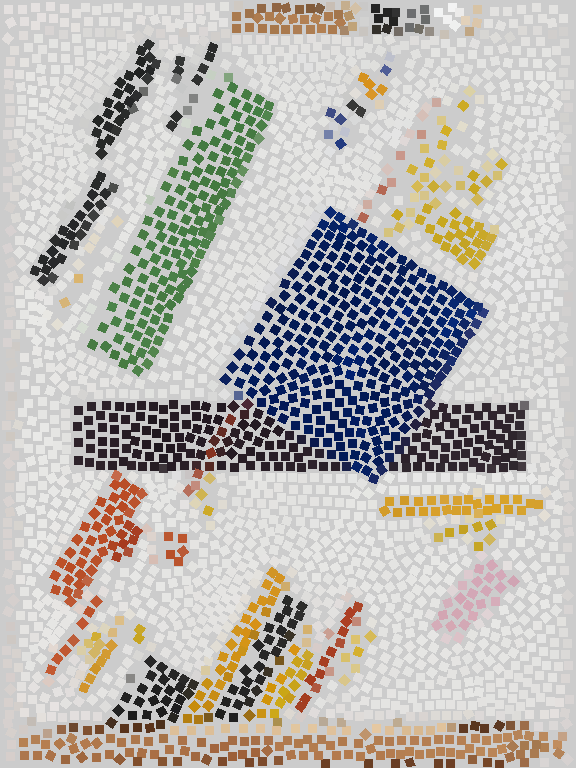
The 2nd image shows the result without removal of tiles with 10px overlap, while the 3rd image shows the result with removal of tiles.
The painting used is Suprematist Composition by Kazimir Malevich.


Taking point colors are a bad idea, especially when the image is a jpg and there is some amount of noise. It is better to pick the color by first applying a small gaussian (sigma = 2) and then taking the average of a box sample (or a point if you like). As noted in the paper by Hausner, "point samples work best for images with uniformly-coloured regions, while area samples suit continuous-tone images".
Average (left) vs Point (right): We see that the colors on the left are more uniform, while the right picture has odd colors in some places.


The following is a personal photograph of the HP Garage in Palo Alto. The 3rd image shows the use of larger tiles (15x15)


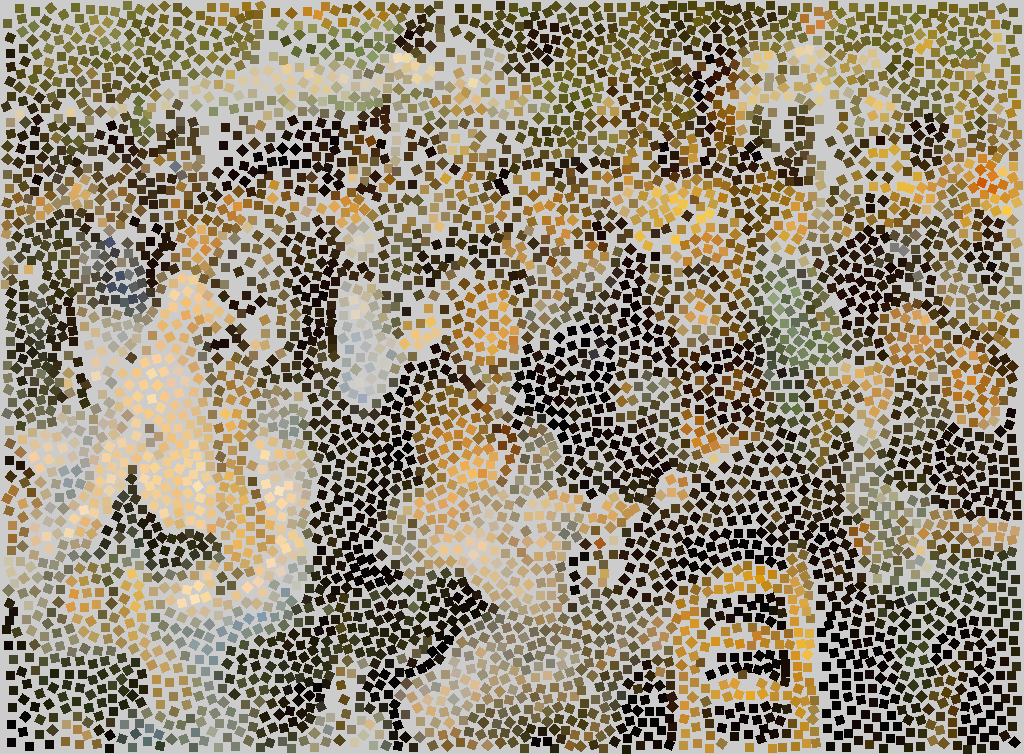
The following is A Wheat Field with Cypresses by Vincent van Gogh.


The following is Vase with Fifteen Sunflowers by Vincent van Gogh.


I also found that mosaics don't work very well for pictures with very high level of detail.
The following is Bal du moulin de la Galette
by Pierre-Auguste Renoir.

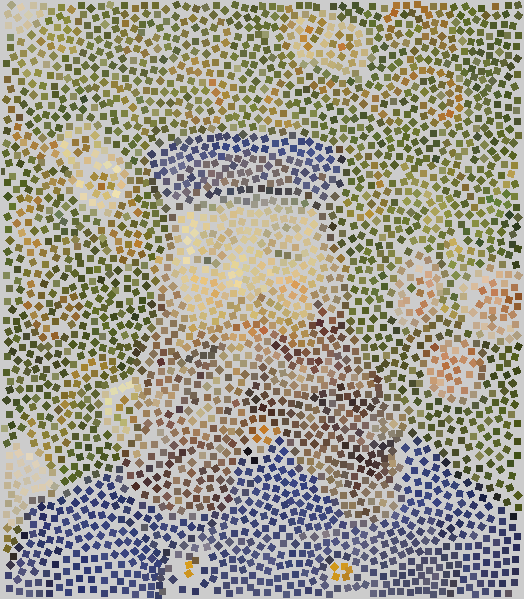
The following is Portrait of Joseph Roulin by Vincent van Gogh.

The following is a personal photograph of the SCS Banner in Wean Hall.
We can see artifacts and details being lost at the bottom of the mosaic.

