Making Sense out of Large Graphs:
Bridging HCI with Data Mining
PI: Christos
Faloutsos, Carnegie Mellon University , phone 412-268.1457,
FAX: 412-268.5576, email: christos AT cs.cmu.edu
Co-PI: Aniket Kittur, Carnegie
Mellon University, 412-268.7505, nkittur AT cs.cmu.edu
Co-PI: Duen Horng
(Polo) Chau, Georgia Tech, 404-385.7682, polo AT gatech.edu
This material is based
upon work supported by the National Science Foundation under Grant
No. IIS-1217559. Any opinions, findings, and conclusions or
recommendations expressed in this material are those of the
author(s) and do not necessarily reflect the views of the National
Science Foundation.
1. GENERAL
INFORMATION
The goal of
this research project is to help people make sense of large graphs,
ranging from social networks to network traffic. The approach
consists of combining two complementary fields that have
historically had little interaction -- data mining and
human-computer interaction -- to develop interactive algorithms and
interfaces that help users gain insights from graphs with hundreds
of thousands of nodes and edges. The goal of the project is to
develop mixed-initative machine learning, visualization, and
interaction techniques in which computers do what they are best at
(sifting through huge volumes of data and spotting outliers) while
humans do what they are best at (recognizing patterns, testing
hypotheses, and inducing schemas). This research addresses two
classes of tasks: first, attention routing -- using machine
learning to direct an analyst's attention to interesting nodes or
subgraphs that do not conform to normal behavior. Second,
sensemaking -- helping analysts build in-depth representations and
mental models of a specific areas or aspects of a graph. Evaluation
of the tools will involve both controlled laboratory studies as
well as long-term field deployments.
As large graphs appear in many settings -- national security,
intrusion detection, business intelligence (recommendation systems,
fraud detection), biology (gene regulation), and academia
(scientific literature) -- the potential benefits of new tools for
making sense of graphs is far reaching. Project results, including
open-source software and annotated data sets, will be disseminated
via the project web site (http://kittur.org/large_graphs/) and
incorporated into educational activities.
1.2.
Keywords
Data mining, HCI, graph
mining.
1.3. Funding
agency
- NSF, Award Number: IIS-1217559, Duration: September 15,
2012 - August 31, 2015
2. Research Highlights & Major Activities

Figure 1. The CrowdScape interface. (A) is a scatter plot of
aggregate behavioral features. Brush on the plot to filter
behavioral traces. (B) shows the distribution of each aggregate
feature. Brush on the distribution to filter traces based a range
of values. (C) shows behavioral traces for each worker/output pair.
Mouseover to explore a particular worker's products. (D) encodes
the range of worker outputs. Brush on each axis to select a subset
of entries. Next to (B) is a control panel where users can switch
between parallel coordinates and a textual view of worker outputs
(left buttons), put workers into groups (colored right buttons), or
find points similar to their colored groups (two middle button
sets).
2.1. Interactive Visualization
One area in which it is challenging
to make sense of large data is understanding how people interact
with an interface: each mouse movement, click, scroll, keypress,
etc. generates potentially useful information but can quickly
become overwhelming. Mining such data could be especially useful
for the growing field of crowdsourcing, in which employers have
little control or visibility into how crowd workers are
accomplishing tasks and often have quality control issues. We
developed a novel system (CrowdScape) which helps researchers to
visualize the behavioral traces of crowd workers and interactively
group them into clusters using machine learning. Each worker's
behavior -- clicks, scrolls, typing, delays, etc. -- is summarized
in a compact row, allowing many workers to be easily compared and
made sense of, with dynamical queries providing an interactive
overview and filtering mechanism. Furthermore, once a worker's
behavior has been identified as high or low quality, CrowdScape
uses machine learning models to propagate these labels to similar
work. This research won the Best Paper award at UIST 2012.
Another significant contribution is our novel decomposition of
canonical graph visualization techniques (e.g., PivotGraph,
semantic substrate) into reusable, atomic interactive
operations/building blocks (e.g., ranking horizontally, grouping
nodes into super nodes). The user can then flexibly combine these
operations to summon graph visualization techniques on demand and
to potentially creating new ones. This investigation has led to an
InfoVis'14 paper and formed the foundation of the thesis of CS PhD
student Chad Stolper (Georgia Tech).
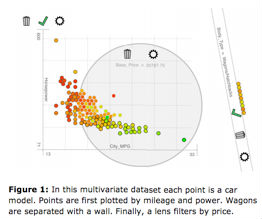
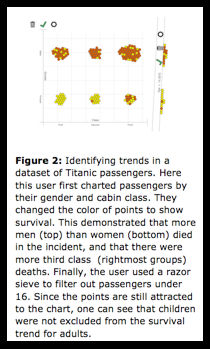
2.2. Multitouch visualization
In the case of highly multivariate
data, it is difficult with desktop-based systems to examine more
than two dimensions of variables due to their structured approach.
Tablets provide a different set of affordances compared to
desktops, and might allow us to interact with data in new ways. We
have used multitouch gestures on a tablet combined with
physics-driven models to create new interaction techniques that
help users to explore more dimensions and make deeper analyses.
Figures 1 and 2 below demonstrate some of the utility of these
techniques. This research was published as an extended abstract at
CHI 2013, where it was also shown as a demo and part of the video
showcase.
2.3. Graph mining algorithms
We are also working on
automatically determining important structures in a graph. The idea
is to use the so-called Minimum Description Language (MDL) to
describe 'important' subgraphs. A subgraph is 'important', if we
can compress it easily: for example a clique of n nodes can be
easily compressed; similarly for a chain, and for a star. Ms. Danai
Koutra is working on the topic, developing scalable heuristics to
solve the combinatorial problem of subgraph selection. Once such
subgraphs are chosen, we plan to show them to the user, in a
compressed form, for example, using a 'box' glyph, to represent a
clique, or a 'star' glyph to represent a star.
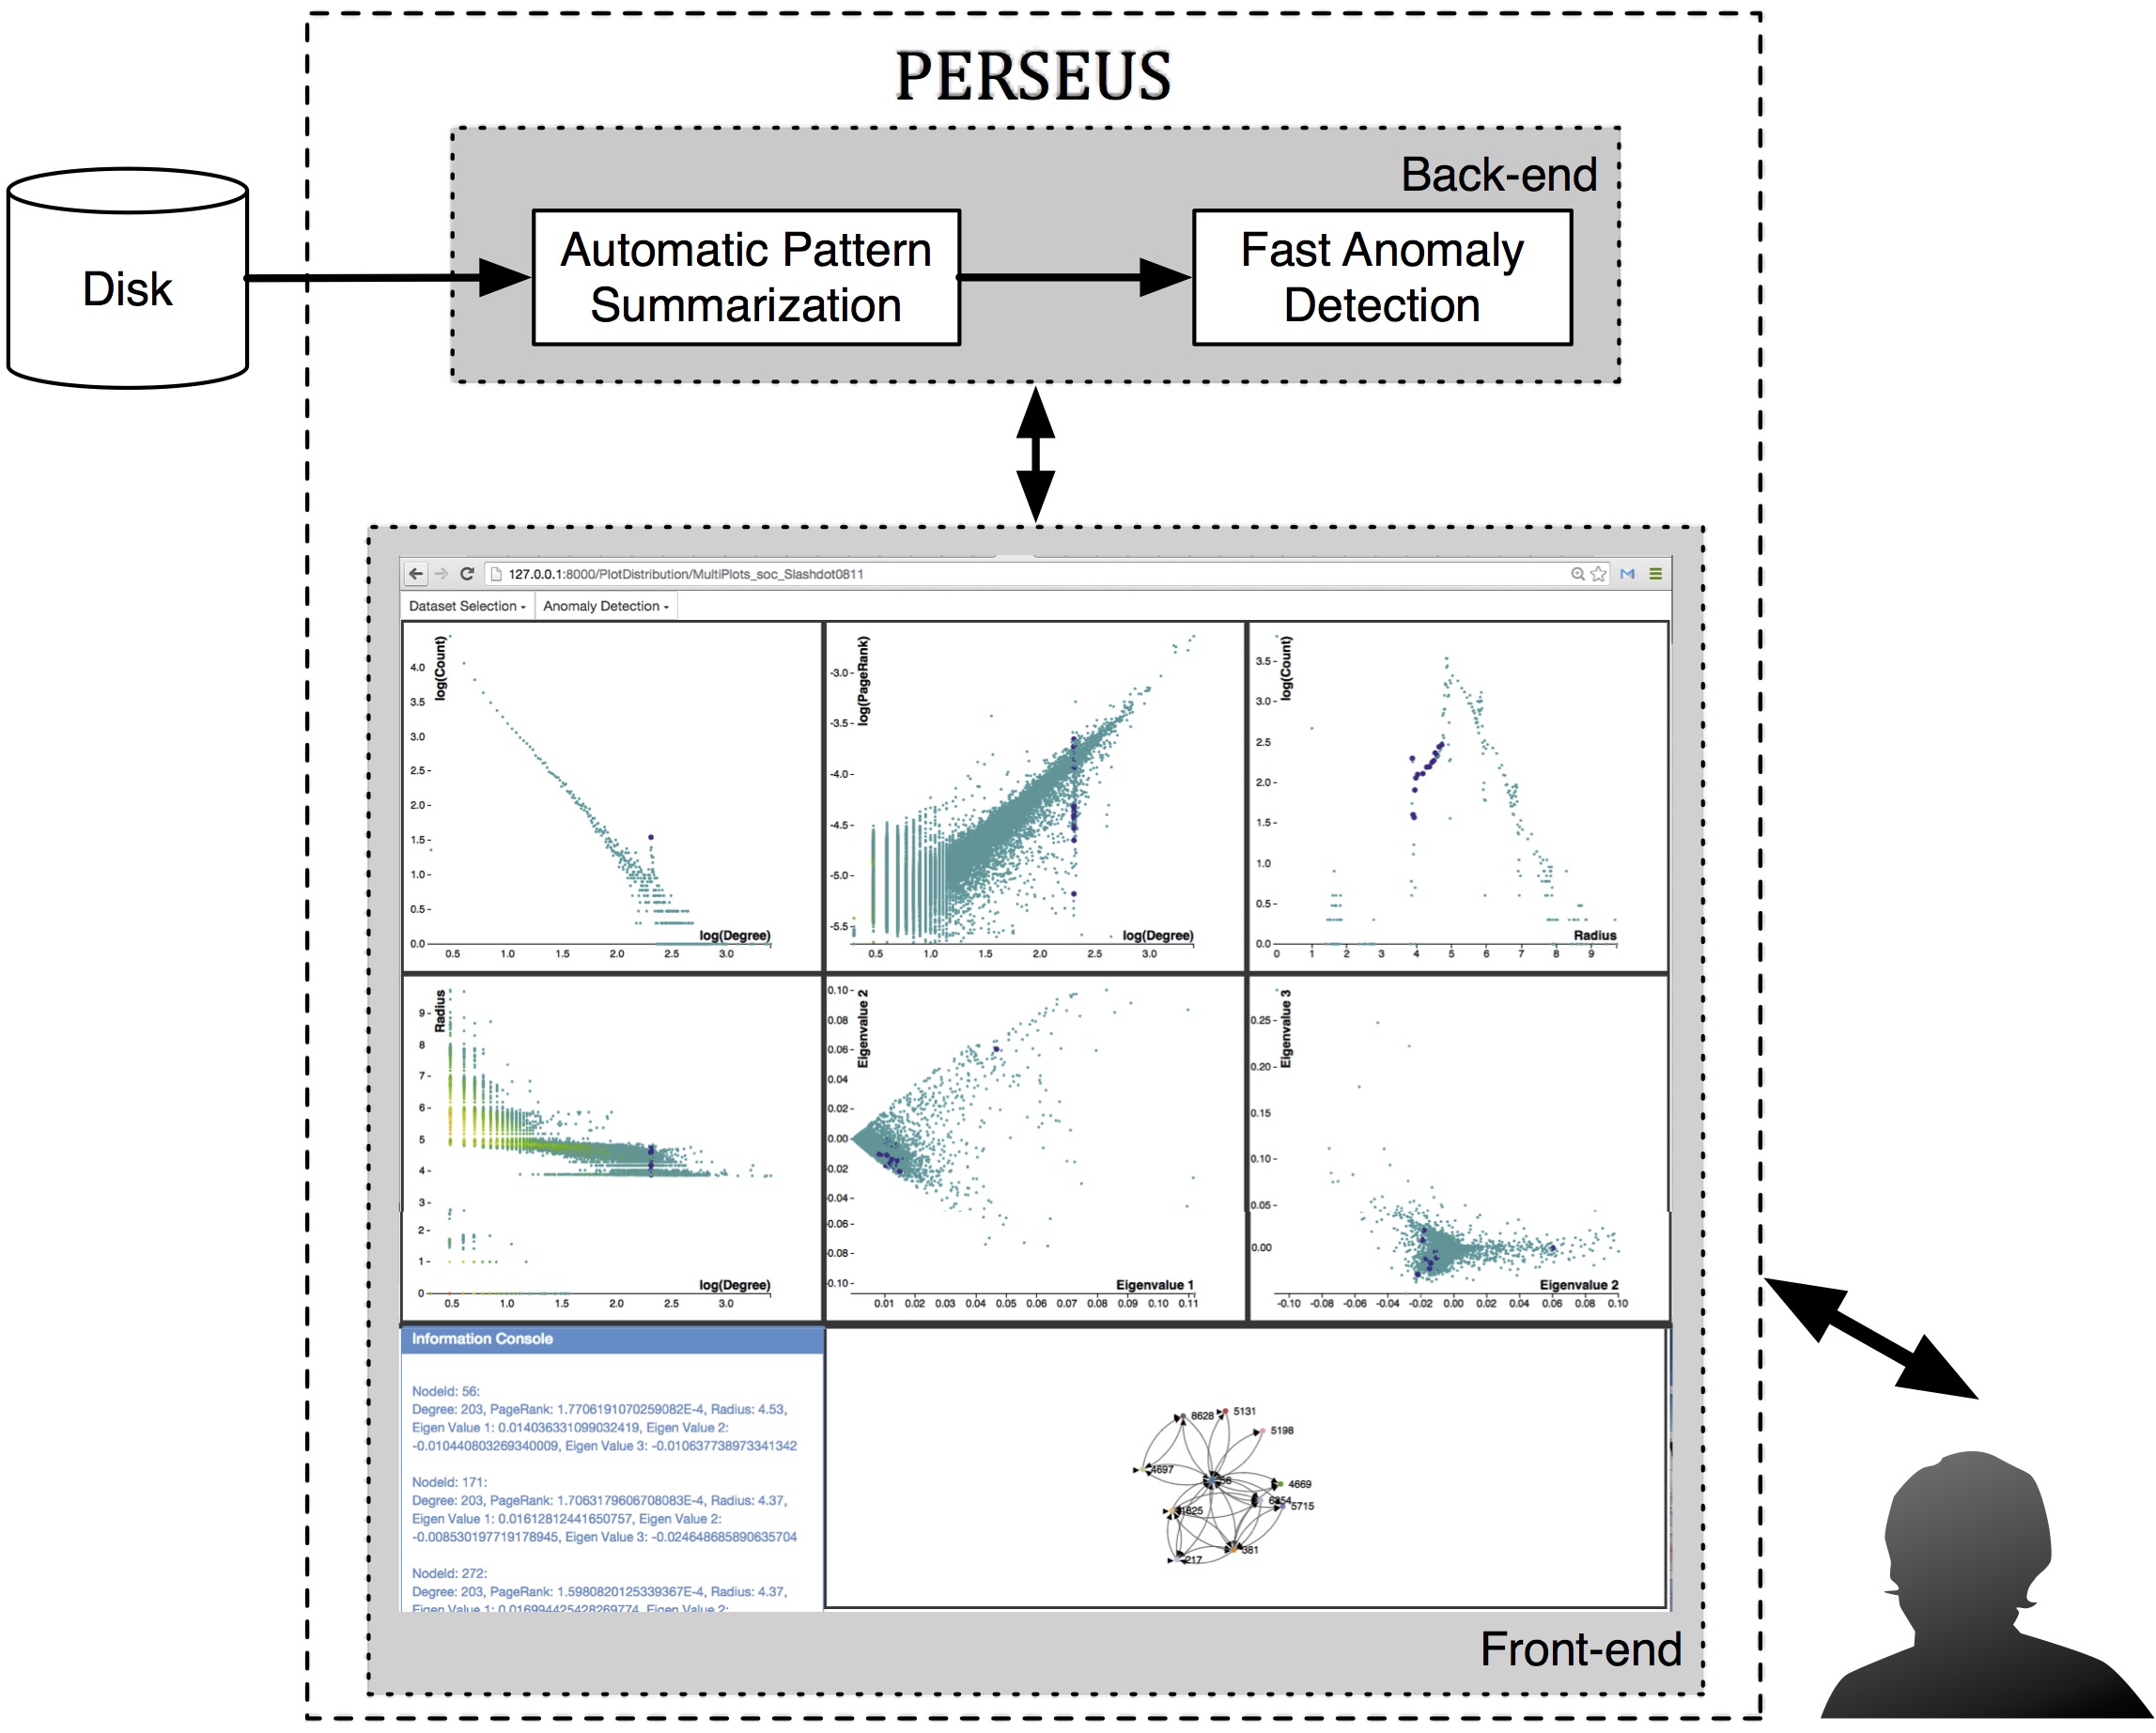
Some of the research highlights
include the TimeCrunch paper in kdd'15 for summarizing and
understanding time-evolving graphs, and the 'Perseus' graph
visualization demo in vldb'15. The over-arching ideas are (a) the
use of MDL (minimum description language) to summarize and
understand large static and time evolving graphs and (b) to present
only a few items to the user each time ('Perseus') and (c) to
strive for attention routing: show the user a quick summary
(through MDL), and draw attention to the most blatant outliers
('Perseus').
Another highlight is our 2015
survey paper that summarizes the latest sensemaking challenges and
opportunities in scalable graph exploration and visualization
[Pienta'15], pinpointing the state of the art accomplishments
(including some of our own) at the intersection of data mining and
HCI and the open problems that the data mining and HCI research
communities may want to join forces to solve.
Through this project, we also
discover a new, simple, and practical way to scale up interactive
analytics to billion-scale graphs on a single PC that uses the
universally available virtual memory / memory mapping (MMap)
capability on all operating systems to store graph data that would
otherwise be too big to fit in RAM. Our approach significantly
outperforms other existing approaches. We published our initial
results at IEEE BigData'14. It could become a promising way to
scale up general machine learning and data mining techniques
without requiring developers and users to "re-learn" or
reimplementing them using custom software frameworks.
 |
 |
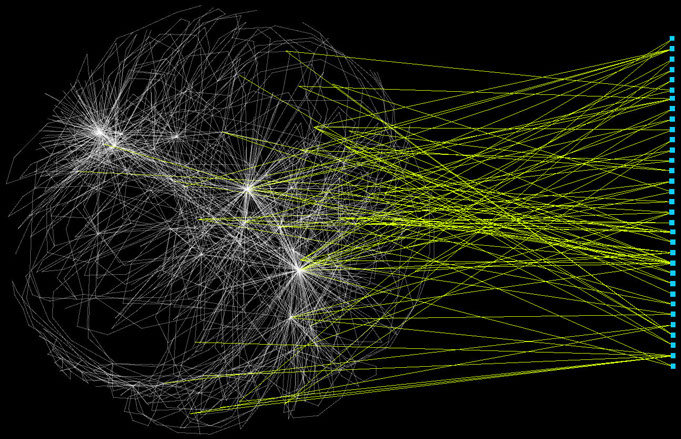
| Figure 3. Wikipedia editors in a
"edit war" on the spelling of "Kiev". |
Figure 4: The 'Perseus' graph
visualization system.
|
2.4. IDEA workshop series and journal
We have co-organized the IDEA workshop (Interactive
Data & Visual Analytics) at KDD'15, '14, and '13 (co-PIs
Chau and Faloutsos, http://poloclub.gatech.edu/idea2015/) as a
concrete, highly visible way to bridge the data mining and HCI
communities. IDEA is one of the largest workshops at KDD, attended
by 100-200 attendees annually. Notably, HCI and visualization key
figures like Ben Shneiderman (UMD) and Marti Hearst (UC Berkeley)
gave keynotes at IDEA. We are also organizing our first TKDD
special issue on IDEA.
3. PEOPLE INVOLVED
In addition to the PIs, the following graduate students work on the
project.
4. Outreach
Research results have been disseminated via lectures in
undergraduate and graduate classes at Georgia Tech and CMU and
other universities. Over 10 talks were given nation wide and
internationally at top venues (e.g., NIPS, CHI, SDM, distinguished
lectures by Faloutsos at U of Toronto, USC, UIC), a tutorial on
graph mining in ICDM'14, and outreach events for undergraduate
students, and the general public.
Dissertation
-
Exploring and Making Sense of Large Graphs Danai Koutra, Ph.D.
Dissertation, August 2015. Winner of the
ACM SIGKDD dissertation award, 2016.
Publications
- EdgeCentric:
Anomaly Detection in Edge-Attributed Networks Neil Shah, Alex
Beutel, Bryan Hooi, Leman Akoglu, Stephan Gunnemann, Disha Makhija,
Mohit Kumar, Christos Faloutsos. International Conference on Data
Mining (ICDM) Cybersecurity Workshop, Barcelona, Spain, December
2016
- Linearized
and single-pass belief propagation, Wolfgang Gatterbauer,
Stephan Guennemann, Danai Koutra, and Christos Faloutsos. PVLDB,
8(5), p. 581-592, 2015
-
TimeCrunch: Interpretable Dynamic Graph Summarization Neil
Shah, Danai Koutra, Tianmin Zou, Brian Gallagher, Christos
Faloutsos. Conference on Knowledge Discovery and Data Mining (KDD),
Sydney, Australia, August 2015
-
Perseus: An Interactive Large Scale Graph Mining and Visualization
Tool Danai Koutra, Di Jin, Yuanchi Ning, Christos Faloutsos.
VLDB 2015, Kohala Coast, Hawaii, Aug. 2015
- Interactive
Querying over Large Network Data: Scalability, Visualization, and
Interaction Design. Robert Pienta, Acar Tamersoy, Hanghang
Tong, Alex Endert, Duen Horng (Polo) Chau. ACM Conference on
Intelligent User Interfaces (IUI). Atlanta, GA, USA. March 29 -
April 1, 2015.
-
Scalable Graph Exploration and Visualization: Sensemaking
Challenges and Opportunities. Robert Pienta, James Abello,
Minsuk Kahng, Duen Horng Chau. International Conference on Big Data
and Smart Computing (BigComp). Jeju Island, Korea. February 9-12,
2015.
-
Spotting Suspicious Link Behavior with fBox: An Adversarial
Perspective Neil Shah, Alex Beutel, Brian Gallagher, Christos
Faloutsos. ICDM 2014, Shenzhen, CN, Dec. 2014.
- GLO-STIX:
Graph-Level Operations for Specifying Techniques and Interactive
eXploration. Charles D. Stolper, Minsuk Kahng, Zhiyuan Lin,
Florian Foerster, Aakash Goel, John Stasko, and Duen Horng Chau.
IEEE InfoVis 2014, November 9-14, Paris, France.
- MMap:
Fast Billion-Scale Graph Computation on a PC via Memory
Mapping. Zhiyuan Lin, Minsuk Kahng, Kaeser Md. Sabrin, Duen
Horng Chau, Ho Lee, and U Kang. Proceedings of IEEE BigData 2014
conference. Oct 27-30, Washington DC, USA.
-
Towards Scalable Graph Computation on Mobile Devices. Yiqi
Chen, Zhiyuan Lin, Robert Pienta, Minsuk Kahng, Duen Horng (Polo)
Chau. IEEE BigData 2014 Workshop on Scalable Machine Learning:
Theory and Applications. Oct 27, 2014. Washington DC, USA.
- Net-Ray:
Visualizing and Mining Billion-Scale Graphs. U Kang,
Jay-Yoon Lee, Danai Koutra, and Christos Faloutsos. PAKDD 2014,
Tainan, Taiwan.
- Influence
Propagation: Patterns, Model and Case Study Yibin Lin, Agha
Ali Raza, Jay-Yoon Lee, Danai Koutra, Roni Rosenfeld, Christos
Faloutsos. PAKDD 2014, Tainan, Taiwan, May 2014.
-
Com2: Fast Automatic Discovery of Temporal (Comet)
Communities Miguel Araujo, Spiros Papadimitriou, Stephan
Guennemann, Christos Faloutsos, Prithwish Basu, Ananthram Swami,
Evangelos E. Papalexakis, Danai Koutra. PAKDD 2014, Tainan, Taiwan,
May 2014.
- VoG:Summarizing
and Understanding Large Graphs Danai Koutra, U Kang, Jilles
Vreeken, Christos Faloutsos. SDM 2014, Philadelphia, PA, April
2014.
- Glance:
Rapidly Coding Behavioral Video with the Crowd Walter S.
Lasecki, Mitchell Gordon, Danai Koutra, Malte Jung, Steven P. Dow
and Jeff P. Bigham. ACM Symposium on User Interface Science and
Technology (UIST'14), Oct. 2014.
-
Graph-based Anomaly Detection and Description: A Survey.
Leman Akoglu, Hanghang Tong, Danai Koutra. Data Mining and
Knowledge Discovery (DAMI), April 2014.
- BiG-ALIGN:
Fast Bipartite Graph Alignment. Danai Koutra, Hanghang
Tong, David Lubensky. ICDM 2013: 389-398
-
Are all brains wired equally? Danai Koutra, Yu Gong, Sephira
Ryman, Rex Jung, Joshua Vogelstein, Christos Faloutsos. OHBM 2013,
Seattle, WA, June 2013.
- TouchViz:
(Multi)Touching multivariate data. Jeffrey Rzeszotarski, Aniket
Kittur. CHI 2013 Video showcase.
- TouchViz:
(Multi)Touching multivariate data. Jeffrey Rzeszotarski, Aniket
Kittur. CHI 2013 Demo.
- TouchViz:
(Multi)Touching multivariate data. Jeffrey Rzeszotarski, Aniket
Kittur. CHI 2013 Extended Abstracts
- CrowdScape:
Interactively visualizing user behavior and output. Jeffrey
Rzeszotarski, Aniket Kittur. UIST 2012: Proceedings of the ACM
Symposium on User Interface Software and Technology. New York: ACM
Press.
Last updated: Jan. 30, 2017, by Christos Faloutsos.