
| < |
Home / |
Astronomy / |
Equipments / |
A CD spectrometer |
> |
|---|
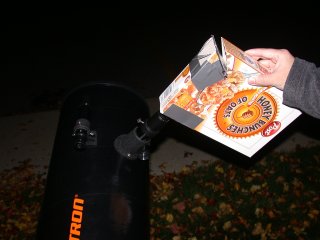
A simple spectrometer can be built from a CD and a box. Cut a slit on one side of the box. Place the CD on the other side with about 60 degree angle. Look down into the openning on the box. The slit should not be too wide, otherwise the spectrum lines will be blurred. It should not be too narrow either, otherwise the spectrum is too dim. I use a 0.2mm wide slit.
|
| structure of the CD spectroscope |
 my cereal box spectroscope (arrow: the slit) |
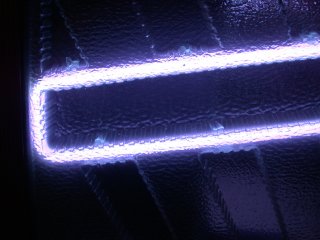
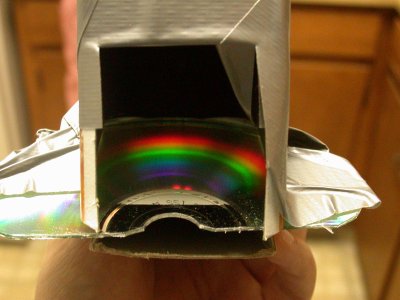 viewing the spectrum |
Let's look at the spectra of some common light sources. All photos by the authors with a Nikon coolpix 995 camera.
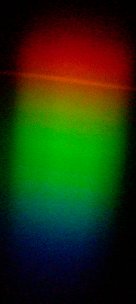
 (1a) afternoon sun, altitude 24 degrees |
 (1b) setting sun, altitude 0.5 degree |
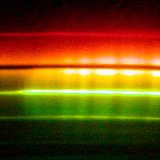
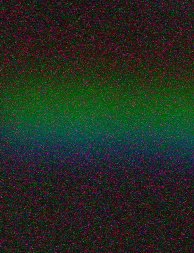
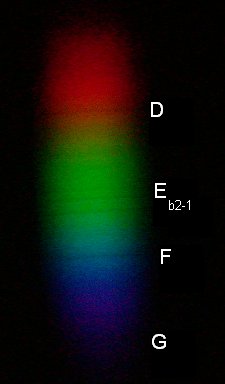
 (1c) high Sun spectrum |
 (1d) low Sun spectrum |
(1) Solar spectrum is continuous with dark lines, i.e. the famous Fraunhofer lines. Several Fraunhofer lines can be seen with this simple spectroscope (1c, 1d): C line in dark red(H-alpha, 656nm), orange D(Na,589nm), green E(Fe,527nm) and b1,b2(Mg,518nm), blue F(H-beta, 486nm), purple G(Fe and Ca, 431nm).
Interestingly the solar spectrum changes with the Sun's altitude! As the Sun is lower its light passes more Earth atmosphere. Comparing (1c) and (1d) we found a new dark line 'a' in red (molecular oxygen in Earth's atmosphere). Who can tell me what the dark band under D is?
 (2a) incandescent light |
 (2b) |
(2) Incandescent light is typical black body radiation, with continuous spectrum. No black lines. Same with tungsten halogen lamp.
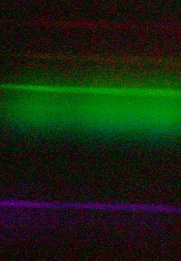
 (3a) fluorescent light |
 (3b) |
(3) Fluorescent light has mercury gas emitting (mostly) ultraviolet light, which activates phosphor. The latter emits broad band visible light. Therefore we see bright mercury spectrum lines, most obviously green 546nm, on a continuous backgroud.
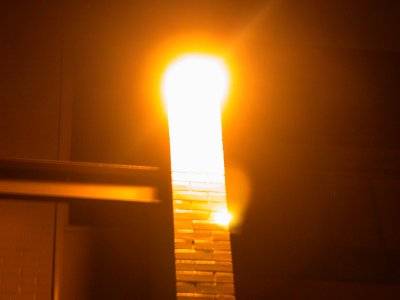 (4a) high pressure sodium light |
 (4b) |
 (4c) |
 (4d) |
 (4e) |
 (4f) |
(4) The spectrum of high pressure sodium lights changes too! When the lamp is just on, there are several bright spectrum lines including yellow sodium at 589nm (4c). In a few seconds as the light gets brighter, the yellow line becomes wider, and a thin dark gap emerges at the center (4d, 4e). After the lamp stablizes, cooler sodium vapor absorbs light at 589nm, and we see a thick gap (4f, 4b). Note the camera settings for (4c--f) are the same.
 (5a) computer display |
 (5b) |
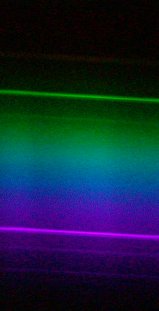
(5) Spectrum of white screen on a computer display.
 (6a) laptop display |
 (6b) |
(6) Laptop display is different from a CRT display.
 (7a) red LED |
 (7b) |
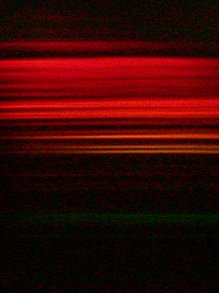
(7) Red LED emits continuous spectrum in red.
 (8a) neon bulb |
 (8b) |
(8) Neon bulb has many red and orange discrete bright spectrum lines.
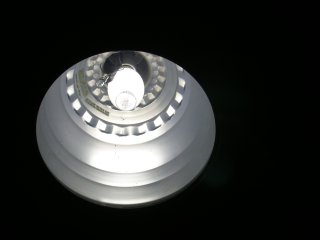
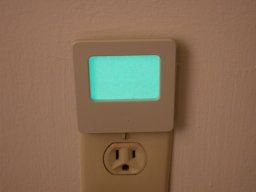 (9a) night light |
 (9b) |
(9) The night light uses phosphors and emits a continuous spectrum.
 (10a) compact fluorescent light |
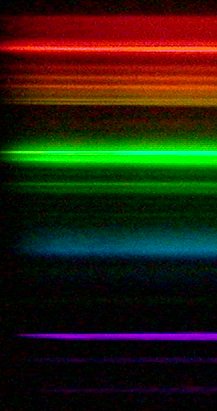 (10b) |
(10) Compact fluorescent light is similar to a normal fluorescent light but with tri-color phosphors. Instead of a continuous backgroup, it emits bright lines of various colors.
 (11a) green and purple neon light |
 (11b) green tube spectrum |
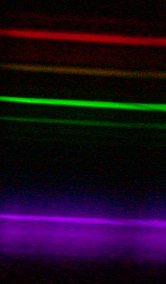 (11c) purple tube spectrum |
(11) The green and purple neon tubes actually contain argon and mercury, with different phosphors produce different color. The mercury line is visible.
 (12a) the moon |
 (12b) use a telescope |
 (12c) lunar spectrum |
(12) I took this photo before the total lunar eclipse of 2004 . Moonlight from a full moon was collected with an 8" Dob telescope. The spectroscope was held behind the eyepiece. As moonlight is nothing but reflected sunlight, the spectrum looks the same as a solar spectrum (1). It is continuous with dark absort lines, i.e. the Fraunhofer lines (some of them are marked).
 (13a) candle |
 (13b) table salt |
 (13c) candle spectrum |
 (13d) table salt spectrum |
(13) Candle light has a continuous spectrum. In the first few seconds after a candle (or a match) is lit, there is also the yellow sodium line which disappears thereafter. If table salt is burnt, the yellow sodium line becomes prominent. The sodium line should be double lines, but this simple device cannot resolve them.
 (14a) metal halide lamp |
 (14b) |
(14) Metal halide lamp has a complex spectrum.
 (15a) blue neon sign |
 (15b) |
 (15c) red neon sign |
 (15d) |
(15) The blue neon sign could be a mixture of argon and mercury (or phosphors). The red neon sign truly contains NEON, which is the same as in the neon bulb (8).
References
CD spectrometer
Science Toys
MiniSpectroscopy
University of Maryland Physics Lecture-Demonstration Facility
Neon FAQ
| < |
Home / |
Astronomy / |
Equipments / |
A CD spectrometer |
> |
|---|