Human-Computer Interface
Keeping track of people, vehicles and
their interactions over a large, chaotic area is a difficult task. We don't
want to subject a human operator to dozens of screens showing raw video
output -- that amount of sensory overload virtually guarantees that information
will be ignored, and requires a prohibitive amount of transmission
bandwidth. Our suggested approach is to provide an interactive, graphical
visualization of the battlefield by using VSAM technology to automatically
place dynamic agents representing people and vehicles into a synthetic
view of the environment. Particularly striking is the amount of data
compression that can be achieved by transmitting only symbolic georegistered
object information back to the operator control unit instead of raw video
data. Currently, we can process NTSC color imagery with a frame size
of 320x240 pixels at 10 frames per second on a Pentium II computer, so
that data is streaming into the system through each sensor at a rate of
roughly 2.3Mb per second per sensor. After VSAM processing, detected
object hypotheses contain information about object type, location and velocity,
as well as measurement statistics such as a time stamp and a description
of the sensor (current pan, tilt, and zoom for example). Each object
data packet takes up roughly 50 bytes. If a sensor tracks 3 objects
for one second at 10 frames per second, it ends up transmitting 1500 bytes
back to the OCU, well over a thousandfold reduction in data bandwidth.
2D GUI and VIS
node
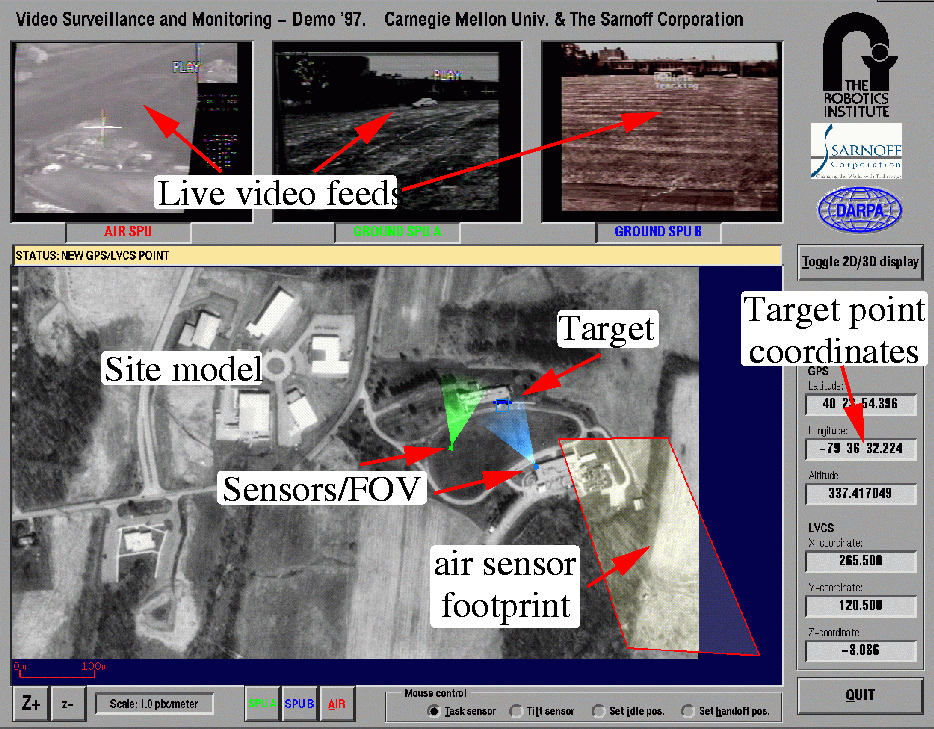
The GUI consists of a map of the site,
overlaid with all object locations, sensor platform locations, and sensor
fields of view. In addition, a low-bandwidth, compressed video stream
from one of the sensors can be selected for real-time display. The
progression of GUI appearances over the three years of VSAM are shown below.
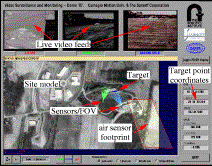
During the first year, the "map" was a USGS orthophoto of the rural demo
site, and three separate video streams were displayed at all times, corresponding
to the three SPUs (2 ground, 1 airborne) that were present in the testbed
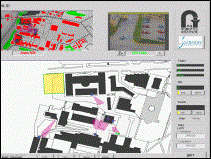
system. During year 2, the system moved to urban campus of CMU, and
the resolution of available orthophotos was not satisfactory to display
precise positions of objects with respect to buildings and roads.
We switched instead to a campus map, scanned in from the university phone
book, and carefully georegistered by hand. As the number of available
SPU's increased, we reduced the video display to one window, through which
video from any camera could be selected for display. A lower-resolution
map view for displaying airborne location and detection results was also
maintained. During year 3, the airborne platform was not used, and
that window was removed. This freed up space for a menu of system
tasking commands, by which the operator can control the system. Also
during year 3, a java-based visualization client was added that can be
played on any laptop connected to the VSAM system network. This display
maintains much of the character of the operator GUI, but without the ability
to control the system.
GUI, 1997 |
GUI, 1998 |

GUI, 1999 |

VIS NODE, 1999 |
Through the current GUI sensor-suite
tasking interface, the operator can task individual sensor units, as well
as the entire testbed sensor suite, to perform surveillance operations
such as generating a quick summary of all object activities in the area.
The lower left corner of the control window contains a selection of
controls organized as tabbed selections, which control corresponding entity
types Objects, Sensors, and Regions of Interest.
-
Object Controls. "Track" directs
the system to begin actively tracking the current selected object. "Stop
Tracking" terminates all active tracking tasks in the system. "Trajectory"
displays the trajectories of selected objects. "Error" displays geolocation
error bounds on the locations and trajectories of selected objects.
-
Sensor Controls. "Show FOV" displays
sensor fields of view on the map, otherwise only a position marker is drawn.
"Move" triggers an interaction allowing the user to control the pan and
tilt angle of the sensor. "Request Imagery" requests either a continuous
stream or single image from the currently selected sensor, and "Stop Imagery"
terminates the current imagery stream.
-
ROI controls. This panel contains
all the controls associated with Regions of Interest (ROIs) in the system.
ROIs are tasks that focus sensor resources at specific areas in the session
space. "Create" triggers the creation of a ROI, specified interactively
by the user as a polygon of boundary points. The user also selects
from a set of object types (e.g. human, vehicle) that will trigger events
in this ROI, and from a set of event types (e.g. enter, pass through, stop
in) that are considered to be trigger events in the ROI.
Insertion into
3D Visualization
Ultimately, the key to comprehending
large-scale, multi-agent events is a full, 3D immersive visualization that
allows the human operator to fly at will through the environment to view
dynamic events unfolding in real-time from any viewpoint. We envision
a graphical user interface based on cartographic modeling and visualization
tools developed within the Synthetic Environments (SE) community.
The site model used for model-based VSAM processing and visualization is
represented using the Compact Terrain Database (CTDB). Objects are inserted
as dynamic agents within the site model and viewed by Distributed Interactive
Simulation clients such as the Modular Semi-Automated Forces (ModSAF) program
and the associated 3D immersive ModStealth viewer. This approach
has the benefit that visualization of the object is no longer tied to the
original resolution and viewpoint of the video sensor, since a synthetic
replay of the dynamic events can be constructed using high-resolution,
texture-mapped graphics, from any perspective.
We first demonstrated proof-of-concept
of this idea at the Dismounted Battle Space Battle Lab (DBBL) Simulation
Center at Fort Benning Georgia as part of the April 1998 VSAM workshop.
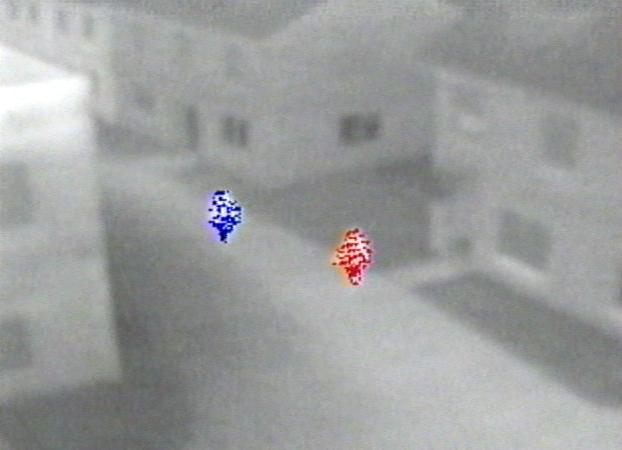
Some processed VSAM video data and screen dumps of the resulting synthetic
environment playbacks are shown below.
We have also demonstrated that this
visualization process can form the basis for a real-time immersive visualization
tool. Object classification information, and geolocation estimates computed
within the frame-to-frame tracking process are transmitted in Distributed
Interactive Simulation (DIS) packets to ModSAF and ModStealth clients through
a network multicast. Objects detected by the SPUs are viewable,
after a short lag, within the context of the full 3D site model using the
ModStealth viewer.

Data Logging and
Web-Page Summarization
For an automated surveillance system
to run unattended, there needs to be a way to log data for later review
by a human operator. We have developed a prototype web-based VSAM data
logging system. All observations can be explored by web browsing via CGI
through an HTTP server, so that VSAM researchers can access the data from
anywhere. There are two ways to view object and activity information.
An activity report shows labeled events such as a "Car Parked'',
or "A Human Entered a Building'', sorted by time. If a user
wants more detail, a hypertext link brings up a page showing an image
chip of the object, along with its class and color information. An object
report shows all of the objects seen by the system, and the activities
to which they are related, sorted by time of observation. To cut
down on information overload, the user can select specific subsets of object
classes to view. When the user selects an object, the system automatically
brings up a page showing other objects of the same class having similar
color features. In this way, it might be possible for a user to detect
the same vehicle or person being observed at different places and times
around the surveillance site.
Click
here for a sample web-based activity report.
Click
here for a sample web-based target report.