If you don't have a copy of the graphics module we used last week, download a copy of this module by clicking HERE. Once this file is downloaded to your desktop, move it to your Python working area (or work on the desktop). This Python module must be in the same folder as any program code that uses it.
Quite often, data that we need for a program will be stored in a data file so we don't have to enter the data one by one using the keyboard. Recall the program we used to find the maximum of a set of 5 numbers:
def main():

        A = [4, 7, 3, 9, 8]

	i = 0
        max = A[0]
	while i < len(A)-1:
		i = i + 1
                if A[i] > max:
                        max = A[i]

        print "The maximum positive integer is", max

main()
Let's assume that there is a text file that contains the 5 data values shown above, one per line. We can modify the program to initialize the list with 5 data values from a file as follows:
def main():

        A = []      # start with an empty list
        filename = raw_input("Input filename containing data: ")
        infile = open(filename, "r")
        for j in range(5):
             number = eval(infile.readline())
             A.append(number)

	i = 0
        max = A[0]
	while i < len(A)-1:
		i = i + 1
                if A[i] > max:
                        max = A[i]

        print "The maximum positive integer is", max

main()
Assume there is a text file named nums.txt in the same folder as our program, and it contains the following data:
4
7
3
9
8
The program starts with an empty array A. It then asks the user for the name of the data file using the raw_input function. For example, the user might enter nums.txt. We then open the file for reading using the open function. The "r" means we want to read from the file specified by the filename. The function returns a link to the file which we store in the variable infile. Then whenever we want to go to the file for data, we use the variable infile.
The program now loops 5 times and reads each line of the file in one at a time, converting the string read in to a value (number) using eval(infile.readline()), and then appending this value to the array. The expression infile.readline() reads the next line from the text file, and the function eval converts it to a number since it is read in as a string.
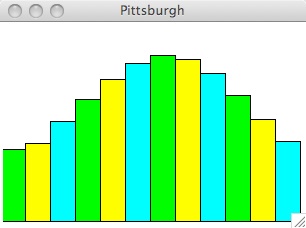
Lets write a Python program that reads in 12 temperatures from a text file into a list. Then we'll create a window that is 300 pixels wide by 200 pixels high. In this window, we'll draw a bar graph that shows these temperatures from January at the left to December at the right. The bottom of the window represents 0 degrees and the top of the window represents 100 degrees. Each bar should be 25 pixels wide. The height of each bar depends on the temperature for each month. The colors of the bars should alternate between green, yellow and cyan. Here's a set of 12 temperatures and what the final bar graph might look like:
36
39
50
61
71
79
83
81
74
63
51
40
To start our program, we need to get our window ready:
from graphics import *

def main():
        win = GraphWin("Pittsburgh", 300, 200)

	# more program code goes here

        raw_input("Press Enter to quit.")
        win.close()

main()
Next, we need to read our data in from the file and store it in a list so we can use that list later to create the bars:
from graphics import *

def main():

        win = GraphWin("Pittsburgh", 300, 200)

        filename = raw_input("Input filename: ")
        infile = open(filename, "r")
        temps = []
        for i in range(12):
                temps.append(eval(infile.readline()))

	# more program code goes here

        raw_input("Press Enter to quit.")
        win.close()

main()
Now, we need to loop through each temperature in the temps list and draw the corresponding bar. Let's look at our example list and determine the exact points needed for each rectangle (bar) for the chart until we see a pattern. Remember that the window size is 300 X 200.
How wide is each bar? Since the window width is 300 pixels and there are 12 months to display, each bar is 300/12 = 25 pixels wide.
Since the window height is 200 pixels and the maximum temperature is 100 degrees (remember, we're asssuming all temperatures are positive here), then one degree is represented by 2 pixels in height. So a bar that is 40 pixels tall represents a temperature of 20 degrees, and a bar that is 164 pixels high represents a temperature of 82 degrees.
How tall is the first bar (for January)? The value for temps[0] is 36, so the rectangle (bar) should be 72 pixels high. But based on the picture, since we want to draw the bar from the BOTTOM of the window, where the y coordinate is 200, the y-coordinate of the top of the bar will be at 200-72=128. So we need to create a rectangle as follows:
rect = Rectangle(Point(0,200), Point(25,200-72))
How tall is the second bar (for February)? The value for temps[1] is 39, so the rectangle (bar) should be 78 pixels high. But based on the picture, since we want to draw the bar from the BOTTOM of the window, where the y coordinate is 200, the y-coordinate of the top of the bar will be at 200-78=122. This bar should be to the right of the January bar, so we need to add 25 to the horizontal coordinates of our points:
rect = Rectangle(Point(25,200), Point(50,200-78))
How tall is the third bar (for March)? The value for temps[2] is 50, so the rectangle (bar) should be 100 pixels high. But based on the picture, since we want to draw the bar from the BOTTOM of the window, where the y coordinate is 200, the y-coordinate of the top of the bar will be at 200-100=100. This bar should be to the right of the February bar, so we need to add another 25 to the horizontal coordinates of our points:
rect = Rectangle(Point(50,200), Point(75,200-100))
Looking at these three examples, we can see a pattern developing. If we represent the month using the variable i (i = 0 for January, i = 1 for February, etc.), we see that we can define the rectangle for a bar as:
rect = Rectangle(Point(i*25,200), Point((i+1)*25,200-(temps[i]*2)))
So our program now looks like this:
from graphics import *

def main():

        win = GraphWin("Pittsburgh", 300, 200)

        filename = raw_input("Input filename: ")
        infile = open(filename, "r")
        temps = []
        for i in range(12):
                temps.append(eval(infile.readline()))

        for i in range(12):
                rect = Rectangle(Point(i*25,200), Point((i+1)*25,200-(temps[i]*2)))
                rect.draw(win)

        # more program code goes here

        raw_input("Press Enter to quit.")
	win.close()

main()
How do we get the bars to alternate colors? Based on the picture,
If we look at the expression i % 3 (that is, i modulo 3), we see
that
i % 3 = 0 when i = 0, 3, 6, 9
i % 3 = 1 when i = 1, 4, 7, 10
i % 3 == 2 when i = 2, 5, 8, 11
So we can now
change colors as follows:
from graphics import *

def main():

        win = GraphWin("Pittsburgh", 300, 200)

        filename = raw_input("Input filename: ")
        infile = open(filename, "r")
        temps = []
        for i in range(12):
                temps.append(eval(infile.readline()))

        for i in range(12):
                rect = Rectangle(Point(i*25,200), Point((i+1)*25,200-(temps[i]*2)))

                if i % 3 == 0:
                        rect.setFill("green")
                if i % 3 == 1:
                        rect.setFill("yellow")
                if i % 3 == 2:
                        rect.setFill("cyan")

                rect.draw(win)

        raw_input("Press Enter to quit.")
	win.close()

main()
SAMPLE DATA FILE:
pghtemps.txt (right click to save, save in the
same folder as your program).
You may assume the data files that we use to
grade your program will have 12 integers in the range 1 to 100 inclusive,
one per line, as in the example data file.