Your results may vary since we're using a random number generator.

for matrix = [[0,2,1,3],[4,5,6,7],[9,3,5,1],[6,2,7,0]]
You may work on this lab with another student if you wish. If you do, put a comment in the program code that includes both of your names, and both of you should submit the code.
In order to draw in Ruby, you need to create a Canvas which you can do as follows:
Canvas.init(width, height, title)
where you replace width, height and title with appropriate values. The width and height are expressed in pixels and the title is a string (with no spaces).
In a window, the coordinate system is upside down from what you might expect mathematically. The x coordinates increase from left to right, but the y coordinates increase from top to bottom. So the origin (0,0) is in the top left corner of the window.
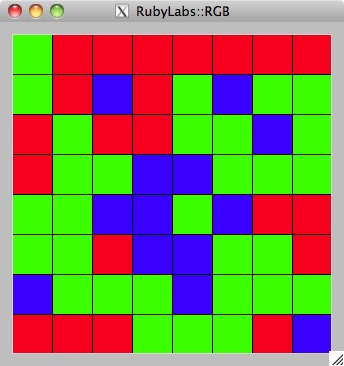
To draw a rectangle using the Canvas, you need to create a new Rectangle and supply the coordinates of the top left and bottom right corners along with additional optional parameters:
Canvas::Rectangle.new(topleft_x, topleft_y, bottomright_x, bottomright_y, optional parameter(s))
For example, to create a red square with a blue border that has a top left coordinate of (100,100) and bottom right coordinate of (110, 110), you would execute:
Canvas.Rectangle.new(100, 100, 110, 110, :fill => "red", :outline => "blue")
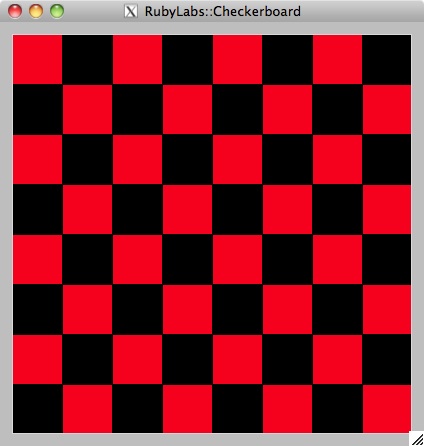
In lab, you will work on the first problem together with your CA to see how to create a function to draw a grid of boxes in a window. Then you will work on the next two problems on your own.
Problems
Your results may vary since we're using a random number generator.
for matrix = [[0,2,1,3],[4,5,6,7],[9,3,5,1],[6,2,7,0]]
At the end of class, handin your work electronically. If you worked with another student, both of you should hand in. (This may require closing the browser and opening up the browser again so the second student can authenticate.)