RESEARCH
SAMPLES
PAPERS
PEOPLE
HOME

All figures generated in Visage.

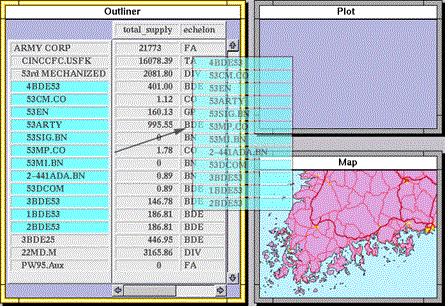
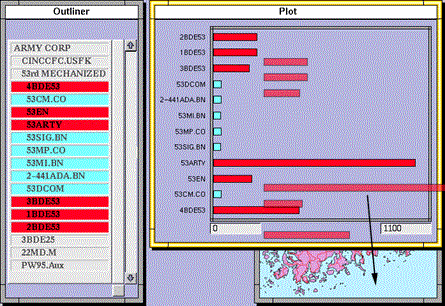
A user may freely drag information from an outliner to other frame types. These other frames can organize and display the data in different ways. Here, we drag a selected set of units from the outliner to a frame that displays its data objects in the form of a bar graph--showing the units' supply weight. This is an important aspect of the information-centric interface approach. Elements representing information are moved by direct manipulation in groups or individually across application interfaces.

The bar chart makes it easy to identify and select the high supply users - those with the longest bars. We can then drag copies of the
elements representing these units to yet another frame, this one displaying the data superimposed upon a map. All three displays are
coordinated - selecting a unit in one highlights it in the others.
Go to next page.

