SDM: Selective Dynamic Manipulation of Visualizations
Mei C. Chuah, Steven F. Roth, Joe Mattis, John Kolojejchick
School of Computer Science
Carnegie Mellon University
Pittsburgh, PA 15213, USA
Tel: +1-412-268-2145
E-mail: mei+@cs.cmu.edu, roth@cs.cmu.edu
ABSTRACT
In this paper we present a new set of interactive techniques for 2D and
3D visualizations. This set of techniques is called SDM (Selective Dynamic
Manipulation). Selective, indicating our goal for providing a high
degree of user control in selecting an object set, in selecting interactive
techniques and the properties they affect, and in the degree to which a user
action affects the visualization. Dynamic, indicating that the
interactions all occur in real-time and that interactive animation is used to
provide better contextual information to users in response to an action or
operation. Manipulation, indicating the types of interactions we
provide, where users can directly move objects and transform their appearance
to perform different tasks. While many other approaches only provide
interactive techniques in isolation, SDM supports a suite of techniques which
users can combine to solve a wide variety of problems.
KEYWORDS: Interactive techniques, visualizations, direct
manipulation
INTRODUCTION
A well-designed visualization can be tremendously helpful in analyzing data.
However, current static visualizations are limited in several important ways:
- Users are not able to focus on different object sets in detail while still
keeping them in context with the environment. This is especially important in
large data sets that have too much information to be displayed in detail at
once.
- When the information space is dense, there will be a lot of clutter and
object occlusion. Occlusion is a serious problem because data-points may be
fully occluded and thus appear invisible to the user. In this way, occlusion
may distort a user's perception of the data-space. In addition, clutter makes
it difficult to perceive patterns in subsets of objects.
- A data set may contain elements that have vastly different values. Thus,
some objects may be dwarfed when shown in the scale used for the entire data
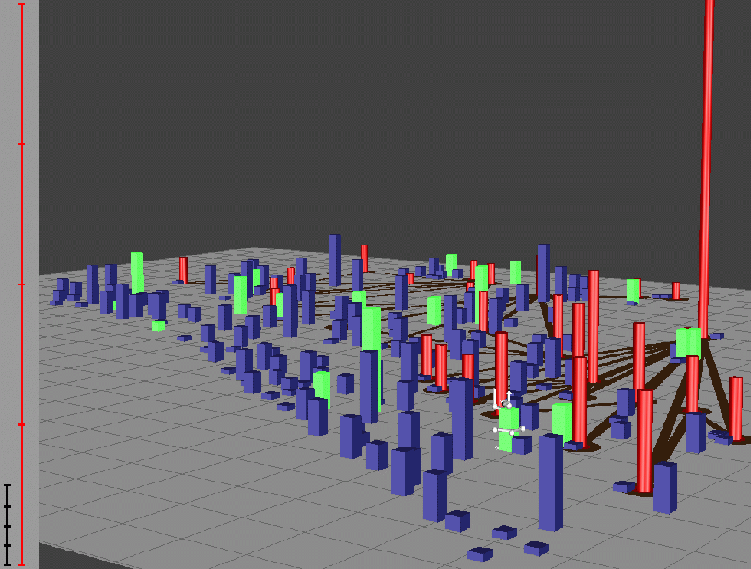
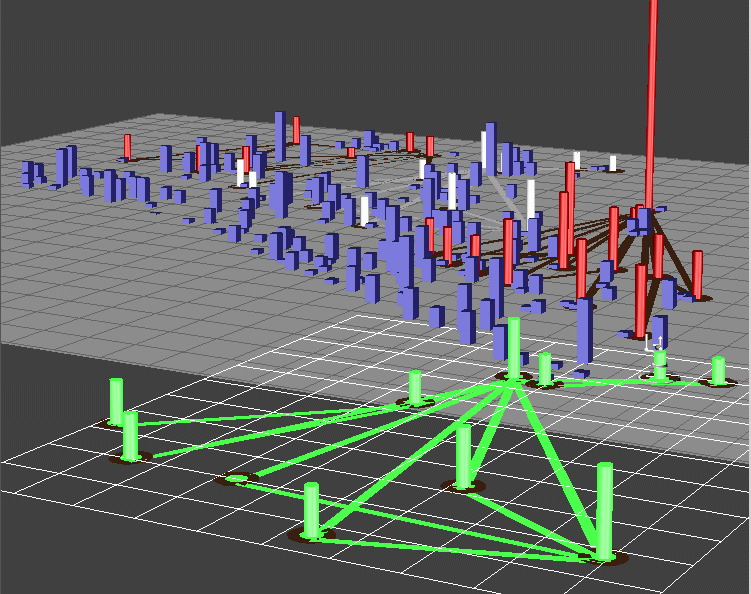
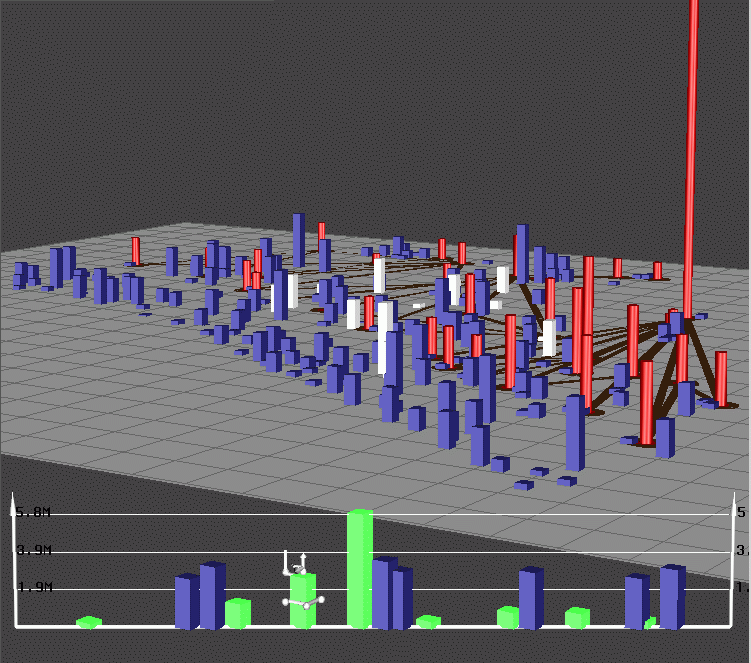
set. In Figure 1, many of the objects (e.g., those in
green) are dwarfed by the tall cylinder towards the right. With SDM we attempt
to provide users with techniques that temporarily change the scale of a
subset of objects, while keeping them in context with the environment.
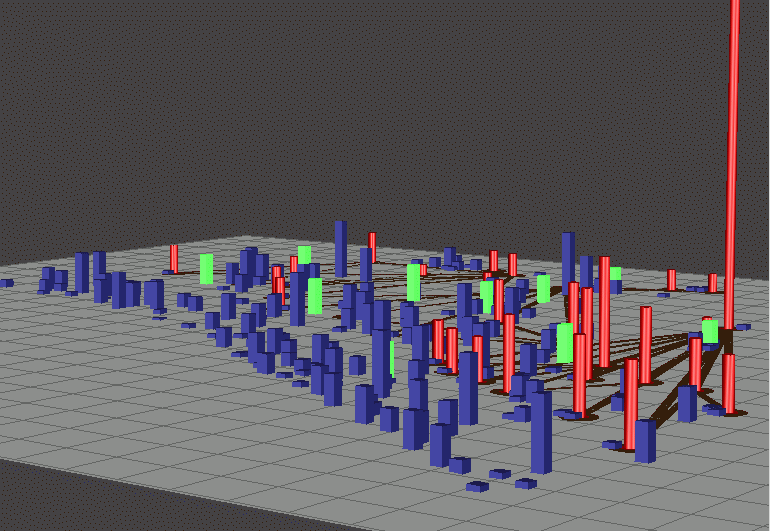
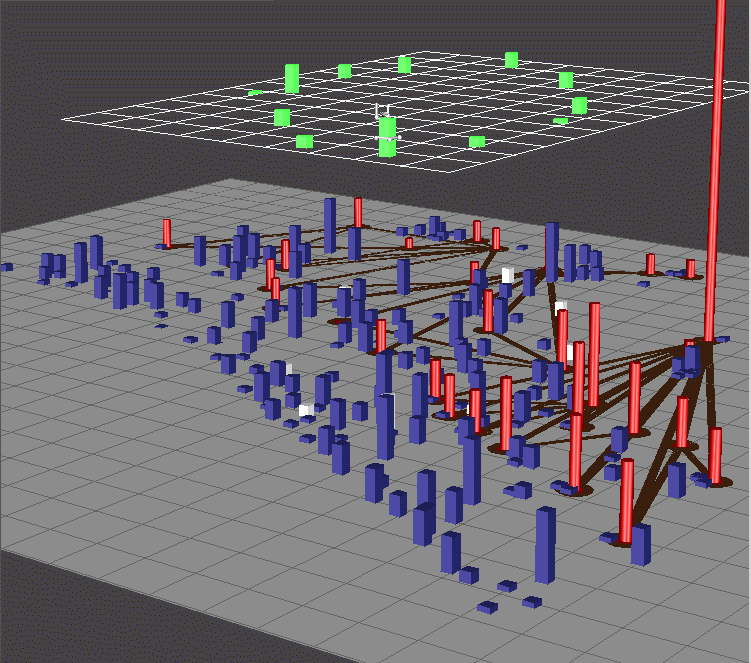
Figure 2 shows the same data set as
Figure 1 except that the green objects have their
heights scaled differently from the rest of the environment. The difference in
height scales is shown by the ratio axes on the left of the visualization. Note
that some of the bars that appeared to have the same height in
Figure 1 actually have relatively large height
differences when put on another scale.

Figure 1: Data visualization of a relief effort data set. Green bars are
the currently selected objects.
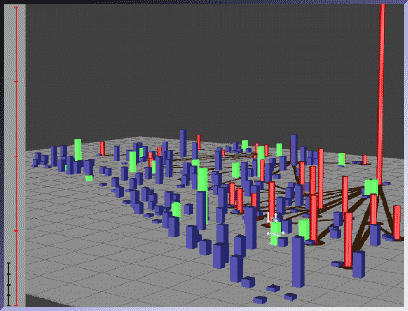
Figure 2: Visualization showing the same data set as
Figure 1, except the heights of the green bars are
scaled differently from the rest of the environment.
- Many visualizations only allow users to view the underlying data. No tools
are provided to classify sets of objects and save those classifications as new
information is discovered. For example, after a user has identified several
problematic/important data points, the user might want to save them as a set
and change their color so that they are differentiated from the other
objects.
- It is difficult to compare quantities represented by graphical objects
which are not spatially contiguous. For example, in
Figure 3 it is difficult to compare which of the
selected shelters (indicated by the green bars) has the most supplies
(indicated by their heights) because they are not at the same distance from the
user.
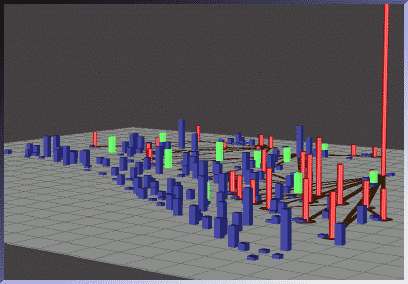
Figure 3: Selected objects that are at different distances from the
user
In this paper we present a paradigm, Selective Dynamic Manipulation (SDM),
which deals with all of the difficulties mentioned above. While some of the
individual techniques that we discuss have been tried before, they have only
been tried in isolation. Instead of isolated solutions, our approach is to
provide a suite of interactive techniques that can be flexibly combined to
solve a wide spectrum of problems. We believe that the unifying framework
behind the techniques will make the system easy to learn, and the flexibility
in using the methods will stimulate users to come up with multiple novel ways
to solve tasks.
Our approach is different from many other interactive systems
[4,9,15,18]
because its selection and control methods are strongly
centered on objects rather than on spaces. The goal of our approach is to
provide a framework for solving a basic set of tasks and problems that are
important when users are analyzing large, diverse data sets.
EXAMPLE DATA DOMAIN
The data domain for our examples is from a supply distribution network
for a relief effort in a large-scale crisis. In Figure 1,
supply centers are represented by cylinders, main routes between them by dark
lines on the floor plane, and shelters where supplies are needed by rectangular
bars. The heights of cylinders and bars indicate the quantities of material
available at supply centers and needed by shelters. See
[14] for color versions of figures.
Next, we outline the basic structure and approach of SDM and discuss how SDM
can be used to address the five limitations mentioned previously.
SDM COMPONENTS
The structure of our SDM system is described based on the three primary
components of interactive techniques: method of selection, interactive
operations, and the feedback mechanisms and constraints placed on the behavior
and appearance of objects.
1) Object-centered Selection
In object-centered selection the focus or selected set is made up of
objects. Selection of these objects is done through their visualized
representations or through data constraints.
Selection in SDM can be accomplished by clicking on objects and/or using
sliders to place data constraints. The slider interface in SDM allows users to
combine data constraints both conjunctive and disjunctively. In the future, we
plan to generalize the selection facility so that there can be multiple linked
displays. Selecting objects in a display will cause objects that have the same
underlying data, in the other displays, to be selected as well.
After object sets are created, they may be named and saved. Users may save as
many sets as they desire. Sets that are created will appear in a scrollable
menu. Selecting a set in the menu causes it to be displayed. All the slider
panels that form the set will also be shown. In this way users may switch
between multiple self-defined sets easily. Note also that the object sets need
not be made up of homogeneous types (e.g., a set may contain supply centers,
shelters and routes).
2) Dynamic and Flexible Operations
Users may directly manipulate object set parameters through object handles.
Direct manipulation refers to operating directly on objects instead of through
menus or dialogues. The Document Lens [12] and Magic Lens
[18] are examples of direct manipulation techniques that
allow users to control their views of objects by operating on a lens. In
contrast to manipulating an external object (such as a lens), SDM allows users
to control an object set by directly controlling any element within that set
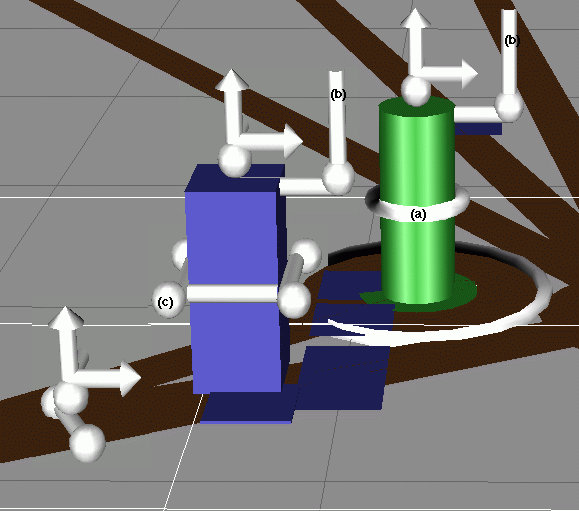
through handles. Figure 4 shows the SDM handles used to
manipulate objects. Our use of handles was motivated by related work on 3D
widgets [7,17] and by 2D scaling
handles in draw programs.
Attaching a handle to an object in a selected set and pulling or pushing its
parts causes some or all objects in the selected set to change. The handles
(Figure 4) were designed to look similar for different
object types so that users need not remember the functions of many visually
distinct handles. When handles are pulled or pushed, the objects contract,
expand or move continuously. Using animation in this way helps users perceive
the changes that have occurred or are occurring to an object set more easily.
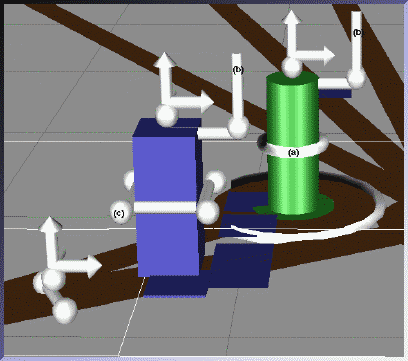
Figure 4: SDM handles
SDM operators can be applied flexibly. SDM allows users to control object
parameters singly or alternatively to control multiple parameters
simultaneously. The latter can be achieved by linking the object controls or by
linking the parameters through formulas. This is in contrast to more
constrained interactions offered by fisheye lenses [4] or
stretching [15], which allow only a fixed technique for
distortion.
Through handles, users may select which object parameters to change. For
example, in Figure 4 part (a) controls the radius of the
cylindrical object, part (b) controls the height of the object, and part (c)
controls the width of the bar. The arrow handles on top of each object in
Figure 4 enable users to shift the objects anywhere in
the 3D space. Parameters can also be combined so that they can be manipulated
through one handle.
3) Object Constraints and Feedback Techniques
SDM is an attempt at introducing a new physics of objects that supports great
malleability and flexible control. In this new physics, an object may pass
through other objects in the scene or have its position or appearance altered.
For example, objects may be elevated (Figure 9) or
translated on the floor plane (Figure 7). Objects may
also have their widths (Figures 6,
11, and 12) or heights
(Figure 2) changed.
We believe that flexibility is key to the success of interactive techniques,
but may lead users to lose context of the environment as well as misinterpret
the data. Thus we have developed a small set of constraints and a suite of
feedback techniques that we believe will help reduce confusion while still
maintaining a high degree of flexibility.
Context persistence is one of the most important constraints in SDM. This is
because many data analysis tasks require users to focus on or manipulate a
select set of objects in the visualization, while still maintaining some
relationship between the focus objects and the rest of the environment. For
this reason we have constrained SDM operations to always maintain various
degrees of context between the focus set and its environment. To this end we
have also introduced feedback mechanisms that help users relate the focus set
to other objects in the visualization without any confusion.
Another constraint in SDM is set-wide operations. All objects in the selected
set are subject to the same forces applied to any object in the set. This is
useful because it helps base SDM techniques on several real-world analogies.
SDM move-shift operations are analogous to putting all objects in the selected
set on a platform and then moving the platform. SDM width and height scaling
operations are analogous to stretching a set of malleable objects from the top
or side with the same force. All these operations maintain the relative
position, width, and height of all objects in the selected set.
A defining feature of SDM is that changes are made to the objects and not to
the view on the objects, as is done in [18]. Because of
this, it is important to clearly indicate which objects have been altered, how
they have been altered and how they can be returned to their home positions. To
serve these purposes, SDM has a set of feedback mechanisms to reduce user
confusion and increase system usability. These feedback mechanisms fulfill the
following functions:
Clearly Identifies the Selected Set, and thus the Objects that will Change
in Response to a User Action. This is done by painting the selected set
differently from all other objects in the scene. In addition, a white grid may
be drawn beneath all selected objects (as is shown in Figures
7 and 9) so that the approximate
positions and spread of its elements can be easily identified.
Maintains Scene Context. When objects are displaced, users need to get
feedback on the original object positions in order to maintain context with the
rest of the environment. One way that SDM achieves this is by having multiple
representations of an object. Each data object is represented by two graphical
representations: the 'body' and the 'shell' graphical objects. Object shells
are left behind in the home position when the object bodies are drawn out and
displaced. Object shells always appear in the original object width and height.
Figures 7, 9, and
13 show some examples of object sets which have been
displaced and their shells, left behind at the original positions, widths and
heights.
Maintains Temporal Continuity. Interactive animation is used to
provide users with temporal continuity so that they can perceive, track and
undo the effects of an operation on the scene. Animation helps users perceive
changes to the scene without having to cognitively reassimilate relationships
between the pre-action and post-action scenes [13].
This shift of cognitive load to the perceptual system allows the user to
concentrate more on the results of an action rather than on the process of the
action. It also provides additional feedback to the user as to which objects
have changed and how they have changed relative to their previous states.
Techniques such as fisheye lenses [4] do not have object
continuity (interactive continuity). Focusing on one point causes a sudden
magnification of that point and demagnification of other regions. Because of
the abrupt change in the visualization it is easy for users to lose track of
where they were before and how they got to the current state. User tests in
[8] showed that insufficient temporal continuity caused
poor user performance in some tasks.
Maintains the Relationships Between the Selected Set and the
Environment. It is important to maintain the relationship between the
selected set and other objects in the visualization so that elements within the
selected set, which may have been altered, can be correctly interpreted with
the rest of the environment. An example of such a feedback technique is the
ratio axes technique (left of Figure 1 and
2). The ratio axes display the scale of the environment
and the scale of the current selected set. By comparing the lengths of the
axes, users can tell what the scale difference is between the selected set and
its environment.
Allows Objects to be Easily Returned to Their Home Positions. Home
mechanisms are available to return objects back to their home positions, as
well as to their original width, height and color. In addition, we have
implemented "object bumpers". It may be hard to manually move objects back to
their home positions because such an action requires precise movement. With
manual control, it is easy to accidentally overshoot the home point. For this
reason, we provide object bumpers, where the initial object move indicates the
direction of freedom, and from then on objects can only be moved back as far as
their home positions.
APPLYING SDM TO VISUALIZATION PROBLEMS
We have discussed five useful operations in the data analysis process that
are lacking in current static visualizations. Next we outline how SDM techniques
can be used to fulfill those needs.
Focusing on a Select Set of Objects while Keeping Scene Context.
While navigating through an information space, it is often necessary for
users to focus on certain parts of that space. However, during and after
focusing, it is important for users to be able to tell where they are in the
information space.
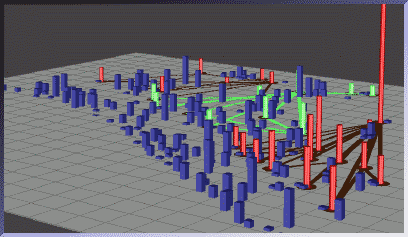
Figure 5: Painting focus objects
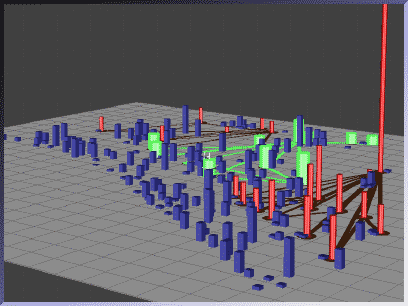
Figure 6: Expanding the selected set in place
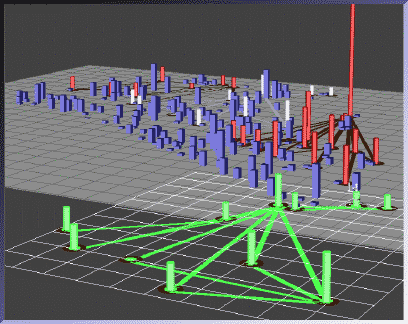
Figure 7: Pulling focus objects to the front
In SDM, focus can be achieved with several strategies. Objects may be painted
so that they appear visually distinct from other elements of the environment.
Objects can also be made more salient by increasing their widths.
Figure 5 shows the original visualization and the
selected object set (shown in green). Figure 6 shows
the visualization after objects in the selected set have been expanded. Spatial
context is maintained in these cases because the objects are not moved from
their original positions. However, some context may be lost because expanding
the selected objects may cause other objects in the scene to be occluded.
Alternatively, users may shift/move all focus objects to the front of the
scene (shown in Figure 7). Context is still maintained
because object shells (shown in white) are left behind. In addition, a user can
move the focus set back and forth between its home position and its position at
the front of the scene to achieve better scene context.
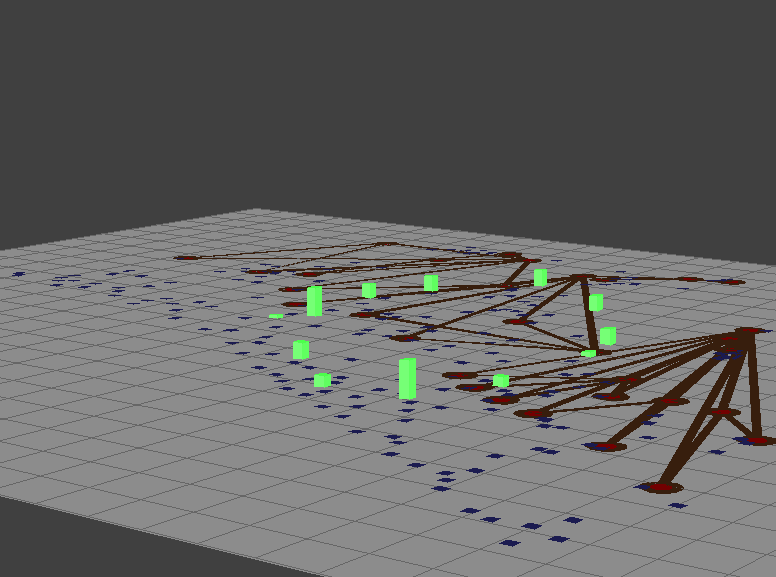
Viewing and Analyzing Occluded Objects.
Occlusion is closely related to the task of focusing while maintaining
context. As was previously mentioned, expanding the selected objects may
introduce occlusion, but this can be prevented by elevating the objects before
expanding them.
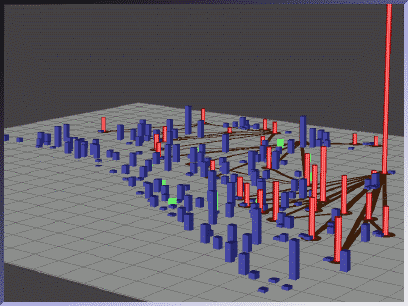
Figure 8: Initial view of occluded objects

Figure 9: Selected object set is elevated to solve occlusion
problem
Figure 8 shows a dense information space with the
interest objects (barely visible) shown in green. Many of the interest objects
are partially if not fully occluded. After elevating the interest objects we
can clearly see the pattern that they form (Figure 9).
Another way to deal with occlusion is to make all objects, other than the
interest set, invisible. This method, however, sacrifices scene context.

Figure 10: Objects other than the selected set are scaled to have zero
height

Figure 11: Objects other than the selected set are scaled to be very
thin
The occlusion problem can also be solved by reducing to zero, the
heights of objects that are not of interest (Figure 10).
In this way, the spatial position of the other objects with respect to the
interest objects is maintained. However, their height patterns are lost.
Alternatively, users may make all objects, except the interest objects, very
thin (Figure 11). This allows us to view the interest
set clearly as well as use object heights to maintain information about the
amount of supplies a center has or that a shelter needs. We are also exploring
the use of transparency to deal with object occlusion.
Viewing Different Sets of Elements Based on Different Scales.
It is often the case, especially in large information spaces, that the
widths and heights of objects are quite diverse. In these instances, the
overall scale used may dwarf some objects, and it would be very difficult to
observe width and height relationships among those dwarfed objects. This
problem is worsened by the aggregation operation, which can create aggregate
objects that show the total value of all its members. These objects will have
much greater values associated with them compared to the other objects in the
environment.
For these reasons it is important to provide ways to view different data sets
at varying scales [6]. SDM allows users to do this. Suppose
a user wants to compare a set of shelters (shown in
Figure 1 in green) with low demand and see
whether the demand distribution of those shelters are in any way related to the
neighboring shelters, routes, and supply centers. To perform this task, the
user can scale up the heights of the selected objects, so they can be compared
more easily (Figure 2). The ratio axes on the left
indicate that the selected objects are now eight times larger than the scale of
the environment.
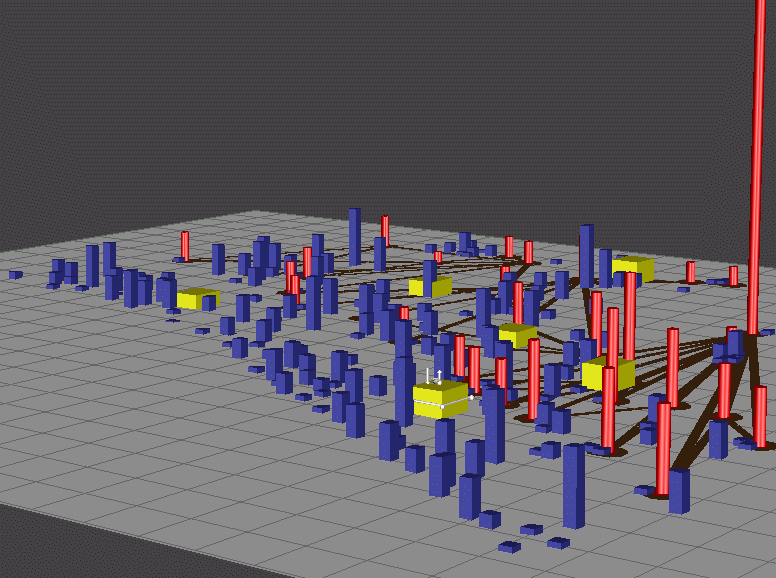
Interactively Augmenting the Visualization with New Classification
Information.
It is often the case that a lot of new insights and information is
revealed during data analysis. However, because this new information is not
part of the underlying data, most visualization systems will not be able to
visualize it until it is fully described in the database. This means that the
newly discovered property will have to be fully characterized and values must
be assigned for it to all elements. This is very cumbersome because it is often
the case that users only have a partial characterization of the property and
may only care about showing it for a subset of objects in the data set. It is
therefore useful to be able to interactively classify subsets of objects in a
visualization as new information is discovered about them.
Object classification is one of the main tasks in data analysis
[16]. To support this task, SDM allows users to
interactively change any property of an object or object set in the
visualization so that they share some common properties that are not present in
other objects in the environment. With this technique users can construct
their own grouping/classification structure by making different subsets of
objects distinguishable from each other and from objects in the environment.
Note that the object sets may be changed and redefined at any time, so users
are free to change the definitions of the classification structure any time
throughout the data analysis process.
In Figure 12 the user has identified some important
shelters. The user has chosen to increase the widths of these shelters as well
as color them yellow, to differentiate them from the other shelters. The new
features that have been added, width and color, only make sense to the user or
group of users that are familiar with this convention. Nevertheless, this
technique is useful because it offers a quick way to add information into the
visualization, very much like the way we annotate printed text or paper maps.

Figure 12: Visualization augmented to show a new property, danger
areas.
Comparing the Patterns, Widths, and Heights of Objects.
In the data analysis process, users frequently compare the various attributes
of data objects. In a visualization, these attribute values are represented by
graphical objects; thus this task reduces to comparing the different parameters
of graphical objects. However, comparisons of object widths and heights are
especially difficult to make in 3D visualizations. This is because it is
difficult to compare the widths or heights of objects that are at different
distances from the user (e.g., the green bars in
Figure 3). The same problems are encountered in 2D
visualizations when trying to compare the lengths of interval bars.
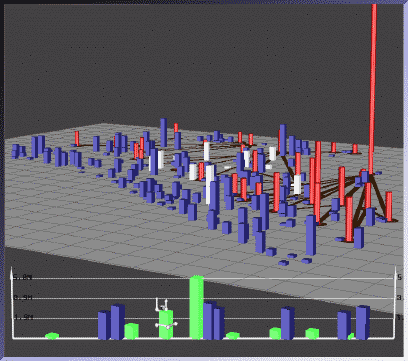
Figure 13: Two sets of objects made for height comparisons
SDM allows users to easily perform comparisons among objects of different
depths by giving users the ability to draw a line of reference in the scene
plane. Users can then move any set of objects to the reference line. By lining
up objects in this way, their heights can be easily compared.
Figure 3 shows the initial visualization and the
selected objects (in green). Figure 13 shows
the visualization after the selected objects have been pulled to the reference
line. To maintain the relationship between objects and their shells, users may
paint the objects which will cause their shells to also be painted. Users may
also slide the objects back and forth between the reference line and their home
points.
In addition to making comparisons within sets, users may also compare height
trends among multiple sets. Figure 13 shows that the
user has lined-up two different sets of objects. From the two lined up sets it
is clear that one set (in green) has larger height variations than the other.
Another typical comparison operation is to find patterns formed by different
object sets and then look for property differences among those patterns. In
large data spaces, it is difficult enough to notice patterns among objects,
much less compare them. This problem can be solved in SDM by separating out
the subsets with the shift-move operator. The spatial shift operation maintains
relative positions among elements within each subset; thus the patterns they
form are preserved. The subsets may be further manipulated in their separate
spaces to tease out any important differences or similarities.
In this section we have presented some techniques that can be used to aid
users in exploring and analyzing large data sets. However, this set of
techniques is by no means comprehensive. We envision that as users learn and
get more comfortable with the system, they will start to combine the basic
operations in new ways to fit their preferences in solving the task at hand.
IMPLEMENTATION
The current SDM implementation was developed in GL and C on a
Silicon Graphics Indigo workstation.
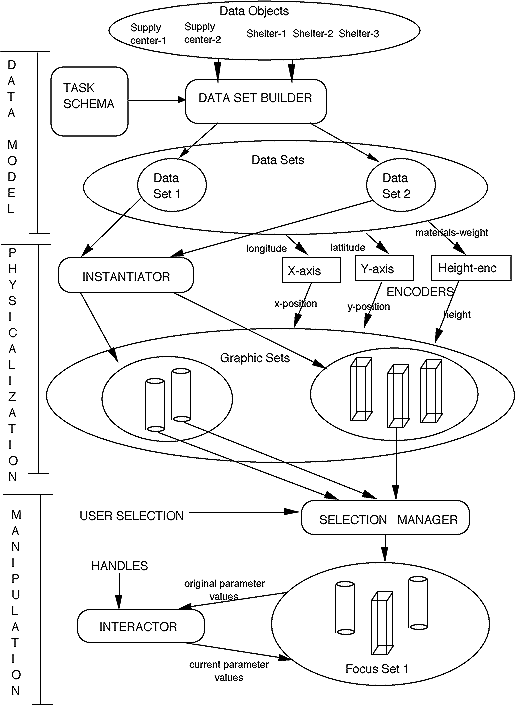
Figure 14 shows the general system architecture. The SDM
architecture can be divided into three main sections: the data modeling
section, the physicalization section and the manipulation section. We discuss
each of these sections in greater detail below.
Data Modeling
The main component in the data modeling process is the data set
builder. The data set builder takes data objects and groups them
into data sets, based on the task being performed. A data set denotes a group
of objects that will be visualized in a uniform manner, and as such can only
contain homogeneous data object types (e.g., a data set of supply centers
cannot also contain supply routes). However, a single data object can occur in
multiple data sets. This allows, for example, a supply center to be grouped
into both the "Critically Important" data set and the "Low on Supplies" data
set.
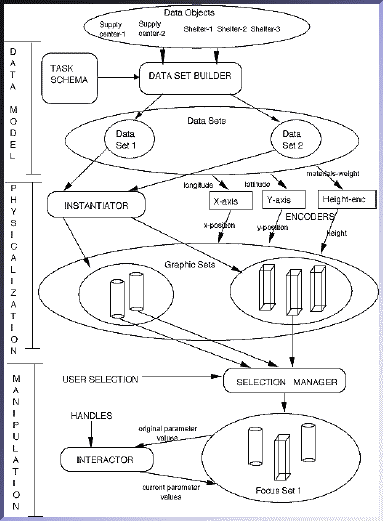
Figure 14: SDM system architecture and information flows
Physicalization
The physicalization process is based on the metaphor of creating "physical"
objects in order to represent abstract data objects. The main component that
performs this process is the instantiator, which has the responsibility
of taking a selected data set and visualizing it as one or more graphic
sets. Every object in a graphic set corresponds to a unique object in the
data set that it represents.
Each object in a graphic set utilizes the same visual specifications. The
specifications define the class of graphic object (e.g., cylinder, bar,
sphere, etc.) that the graphic set will contain, along with the mapping between
select attributes of the data objects and the various physical properties of
the graphical objects. For example, a data set of supply centers might be
visualized as a set of cylinders; where the "materials-weight" attribute is
mapped to the height of the cylinder, and the "longitude" and "latitude"
attributes are mapped to the x and y location of the cylinder.
Encoders perform the actual conversion of data-values (e.g., pounds of
food) into graphical-values (e.g., height in inches). Some examples of
encoders are x-axis encoders, y-axis encoders, and color-key encoders.
Physical object properties that do not encode a data attribute are assigned a
default value.
A single data set may be visualized as multiple independent graphic sets, in
single or multiple data-graphics. Objects from the various graphic sets may
encode different attributes of the data set, or may encode identical attributes
of the data set multiple times. Allowing a data set to be multiply represented
is useful in the case where a single graphical set is insufficient to
effectively show all important attributes of the data set. It is also useful in
those cases where we want to strengthen the effect of a data attribute by
encoding it twice.
Manipulation
Once data objects have been "physicalized" as graphic objects, SDM gives
users the ability to move and stretch the graphic objects, analogous to the
manner in which users might manipulate physical models placed on a table.
However, the "physics" provided by SDM is not limited to real-world
manipulations; users can also elevate, compress, and perform other operations
upon objects that wouldn't be possible with actual physical models. Thus, SDM
exploits common physical metaphors so that users may quickly get comfortable
with the system, and then extends these metaphors to take full advantage of the
capabilities that real-time computer graphics provide.
There are two main components to the manipulation process: the selection
manager and interactors. The selection manager enables users to group
graphical objects into alternative focus sets. Users can group objects by
selecting them with the mouse or by manipulating sliders and buttons, actions
which the selection manager interprets to construct a focus set. Users can
switch between focus sets in order to quickly locate objects that are relevant
to the current task. Users may also save any focus set that might be relevant
to a later task. This focus set will be present the next time the system is
invoked.
The other major component of the manipulation is the set of
interactors. Each focus set is associated with an interactor, which is
responsible for changing the physical appearance of graphical objects in that
set. Interactors are controllable through the handles that can be attached to
objects in the visualization. Pushing or pulling on a handle causes the
interactor to transform the values of select properties of graphical objects.
Thus, encoders generate the original appearance of the graphical objects, based
on the data that they represent, while interactors perform transformations on
these properties to manipulate the objects as serves the user's purpose.
Values are only changed for those objects which have the properties that are
being controlled. Because SDM allows for heterogeneous focus sets, it is
possible that a set may contain bars, cylinders and lines. Operating on the
radius property only affects the cylinders, since radius is not a property of
bars or lines.
An interactor may be classified based on its two properties: cardinality
and type. Cardinality indicates the number of properties that the
interactor affects, and may be single or multiple. Single property interactors
include those that change the height of an object, and those that move the
x-position of an object. Multiple property interactors use constraints or
evaluation functions to determine a "derived" property for an object, based on
several of its basic properties. An example of a multiple property interactor
is the alignment interactor, which transforms object positions in order to
scale their perpendicular distance to a line on the object plane.
Type indicates the nature of the graphical transformation, and may be
scale or shift. Shift interactors add constants to object properties. They are
usually applied to graphical properties that are not relevant to the user's
immediate task in order to make other properties more noticeable. An exception
to this is position, since shifting objects to the front can make their
relative positions more apparent. Scale interactors, on the other hand,
proportionately transform property values so that they maintain their ratios
relative to each other. They are typically used to enhance differences among
the data values that are encoded.
PREVIOUS WORK
Previously, we discussed how SDM deals with the five limitations of current
static visualizations. In this section we discuss how other interactive systems
deal with these limitations. In doing this we highlight some of the major
differences and the advantages and disadvantages of SDM compared to other
systems.
Focusing on a Select Set of Objects while Keeping Scene Context.
Focus areas can be made larger in two ways: object magnification and
spatial magnification. SDM uses object magnification, which only
acts on the objects and not on the space between objects.
Magnification in other interactive techniques
[3,4,15,18]
is spatial because expanding the selected set causes the entire selected space
to expand and not just the objects within it. Thus, the objects move out of
their original positions and farther away from each other as their size
increases. In [8], subjects found the change in distances
between objects to be disorienting and jarring. In addition, because the
between-object spaces have expanded, either some other space has contracted
(as in [4] and [15]), or some objects
are now occluded by the newly expanded region (as in a magnification magic lens
[18]). Another disadvantage of spatial magnification is
that is works well on tasks that are strongly based on object spatial position
but fail when users want to focus on multiple object sets based on non-spatial
properties.
Like some spatial magnification techniques, object magnification also faces
the problem of occlusion. In object magnification many of the newly expanded
objects may occlude or collide with other objects. This problem can be solved
in SDM by elevating the expanded objects.
In contrast to spatial magnification, however, object magnification works for
both spatially and non-spatially based tasks. For spatially based tasks users
can simply collect all the data points in the desired space (either through
their longitude and latitude or by selecting them from the visualization) and
form a data set. Operating on that data set would effectively produce the
effect of operating on the area that contains the data points. One disadvantage
of object magnification, however, is that users cannot operate on parts of
objects. For example, enlarging a particular road would mean that the whole
road has to be enlarged and not just part of it. To solve this problem we are
currently exploring techniques that combine spatial and object metaphors.
Some interactive techniques do not use magnification for focusing. Instead,
they allow users to focus on certain data points (objects) by giving users the
ability to change the appearance of object groups in real-time. Objects that
are not in focus are either temporarily invisible [1] or
uncolored [11] (i.e., they have a different appearance
than the objects that are in focus). Users may easily regain context by making
the invisible points reappear [1] or from the uncolored
points [11].
Another important issue of focusing in context is the scope of the operation.
Techniques such as fisheye lenses [4] and stretching
[15] have unlimited scope because changes to the selected
set causes changes to occur throughout the visualization. SDM and other
techniques such as magic lenses [18] have limited scope in
that operations affect only the selected space(s). Unlimited scope may be
disconcerting to the user because a local action may affect objects in the
entire visualization. A disadvantage of limited scope is that it may cause
certain objects/regions to be occluded by the focus objects/regions.
Viewing and Analyzing Occluded Objects.
In dense information spaces, object occlusion is a major problem. Dynamic
query sliders [1] solve this problem by providing users
with the ability to flexibly change the visibility of objects. Other
techniques deal with occlusion by only partially displaying the objects. For
example in [2], when the telephone links are too dense,
only sections of the links are shown to reduce occlusion. A problem with the
approach in [2] is that the technique is limited to the
length of the lines. In SDM, we propose more general techniques that apply to
multiple object types.
Viewing Different Sets of Elements Based on Different Scales.
Under the stretching paradigm [15], this problem may be
solved by pulling on the region surrounding each of the small objects in order
to extend their heights. Care must be taken that the force applied to all
objects is equal so that the object heights can be fairly compared. To solve
this problem using fisheye lenses would be just as awkward because all
dimensions of the objects would be magnified, not just its heights.
Another way to analyze objects that have widely differing widths and heights
is to change the width and/or height scales to a logarithmic scale. In this way,
width/height order is maintained. However, the linear relationships between the
objects are lost. Therefore, it would be hard to compare the heights of two or
more bars and determine approximately how much wider or taller one is than
another.
Interactively Augmenting the Visualization with New Classification
Information.
Painting is a way to classify object sets by using color. SDM allows users to
classify objects not only by changing their color but also by changing any
other parameter. In addition, current classification methods only have
temporary effects, whereas SDM allows users to save objects sets to disk and
restore them in future sessions.
Comparing the Patterns, Widths and Heights of Objects.
The calendar visualizer [10] solves the problem of
width and height comparisons by using lighting to cast shadows on the back and
side planes of the visualization (i.e., projecting an orthogonal image/shadow
of the scene onto a flat plane). The main problem with this method is
difficulty in identifying an object and its corresponding shadow. In addition,
if the information space is dense, there will be too much overlap between
shadows of the focus set and shadows of objects that are not relevant.
In general, the approach taken by SDM is different from other approaches
because SDM provides a flexible set of methods that allow users to manipulate
their information space in many different ways. Many other interactive
techniques only allow users to distort the information space based on a fixed
method. Fisheye lenses [4] and stretching
[15] allow users to increase the area of the focus region
by reducing the area of surrounding regions. Painting [11]
allow users to focus on the selected set by changing its color.
An exception to this is the magic lens technique [18],
which allows many different distortions depending on the lens that is being
used. Like SDM, that research defines a unifying paradigm, derives a tool set
from it, and provides composition of multiple operations. SDM operations,
however, are designed to enable users to directly manipulate object appearance
as they would in a draw program. Lenses, on the other hand, provide metaphors
for viewing regions containing objects in different perspectives and can be
general-purpose (e.g., to distinguish occluded objects) or application-specific
(e.g., to view semantically related properties of objects). Unlike SDM, lenses
do not address parameter manipulation per se.
CONCLUSION AND FUTURE WORK
We have presented a suite of techniques based on the SDM paradigm. These
techniques enable users to:
- View selected objects in detail while keeping them in context with the rest
of the environment.
- View occluded objects by elevating them or by reducing the widths and
heights of surrounding objects.
- View different object sets in different scales.
- Add new information to the visualization that is not part of the underlying
data.
- Compare the widths and heights of objects even when they are positioned far
from each other.
Many current interactive techniques tend to examine and present solutions to
isolated problems. The goal of SDM is to provide users with enough tools and
flexibility that they can solve a wide spectrum of data analysis tasks. The
flexibility provided also presents users with multiple alternative solutions
for any given task. Although the examples presented in this paper use
rectangular objects and cylinders, the same techniques apply just as well to
other graphical objects.
In the future, we plan to integrate current SDM operations with other
aggregation and interactive data manipulation interface techniques
[5, 14]. We also intend to explore the
possibility of using SDM to perform "what if" analyses, where changes to
objects in the visualization actually propagate to the data objects that they
represent.
ACKNOWLEDGMENTS
Funding for this project was provided by the Advanced Projects Agency
(DAAA1593K0005) and the Army Research Laboratory.
REFERENCES
1. Ahlberg, C., Williamson, C., and Shneiderman, B. Dynamic queries for
information exploration: An implementation and evaluation. Proceedings CHI
`92 Human Factors in Computing Systems, ACM, May 1992, pp. 619-626.
2. Becker, R.A., Eicks S.G., and Wilks, A.R. Visualizing network data.
IEEE Transactions on Visualization and Graphics, March 1995, pp. 619-626.
3. Bederson, B.B., and Hollan, J.D. PAD++: A zooming graphical interface for
exploring alternate interface physics. UIST `94, November 1994, pp.
17-27.
4. Furnas, G.W. Generalized fisheye views. Proceedings CHI `91 Human
Factors in Computing Systems, ACM, April 1991, pp. 16-23.
5. Goldstein, J.,
Roth, S.F.,
Kolojejchick, J.,
and Mattis, J.
A Framework for
knowledge-based interactive data exploration. Journal of Visual
Languages and Computing, No. 5, 1994, pp. 339-363.
6. Herndon, K.P., van Dam, A., and Gleicher, M. Workshop report: The
challenges of 3D interaction. CHI '94 Human Factors in Computing Systems,
ACM, May 1994, pp. 469.
7. Herndon, K.P., and Meyer, T. 3D widgets for exploratory scientific
visualization. UIST `94, November 1994, pp. 69-70.
8. Hollands, J.G., Carey, T.T., Matthews, M.L., and McCann, C.A. Presenting a
graphical network: A comparison of performance using fisheye and scrolling
views. Designing and Using Human-Computer Interfaces and Knowledge Based
Systems, Elsevier Science B.V., Amsterdam, 1989, pp. 313-320.
9. Lamping, J., Rao, R., and Pirolli, P. A focus+context technique based on
hyperbolic geometry for visualizing large hierarchies. Proceedings CHI '95
Human Factors in Computing Systems, ACM, May 1995, pp. 401-408.
10. Mackinlay, J.D., Robertson G.G., and DeLine, R. Developing calendar
visualizers for the information visualizer. UIST '94, November 1994, pp.
109-119.
11. McDonald, J.A. Painting multiple views of complex objects.
ECOOP/OOPSLA '90 Proceedings, October 1990, pp. 245-257.
12. Robertson, G.G., and Mackinlay J.D. The document lens. UIST '93,
November 1993, pp. 101-108.
13. Robertson, G.G., Mackinlay, J.D., and Card, S.K. Cone trees: Animated 3D
visualizations of hierarchical information. Proceedings CHI '91 Human
Factors in Computing Systems, ACM, April 1991, pp. 173-179.
14. Roth, S.F.
The SAGE Project.
http://www.cs.cmu.edu/Web/Groups/sage/sage.html
15. Sarkar, M., Snibbe, S.S. Stretching the rubber sheet: A metaphor for
viewing large layouts on small screens. UIST `93, November 1993, pp.
81-91.
16. Springmeyer, R.R., Blattner, M.M., and Max, N. L. A characterization of
the scientific data analysis process. Visualization '92, October 1992,
pp. 235-242.
17. Stevens, M.P., Zeleznik, R.C., and Hughs, J.F. An architecture for an
extensible 3D interface toolkit. UIST `94, November 1994, pp. 59-67.
18. Stone, M.C., Fishkin, K., and Bier, E.A. The movable filter as a user
interface tool. Proceedings CHI '94 Human Factors in Computing Systems,
ACM, April 1994, pp. 306-312.

Return to SAGE Home Page
Sean Cier (scier@cmu.edu)
Last update: 5 December 1995