Insulin signaling pathway
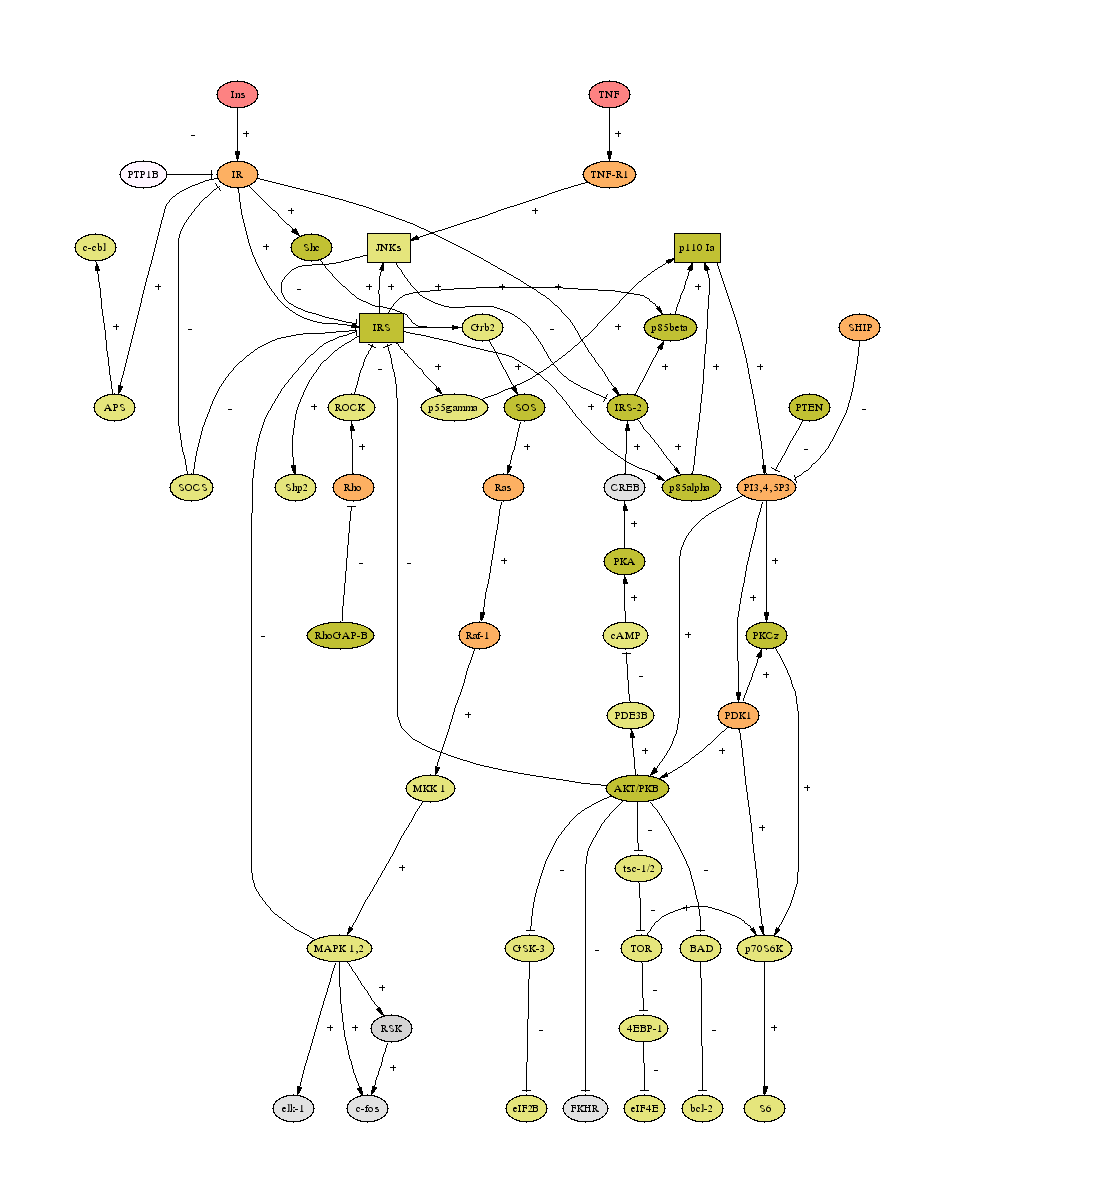
Insulin signaling pathway is conserved across species. The figure ( Garofalo, TIEM 2002, pdf) below shows the conserved pathways in fly, worm and mammals. Although, it is not clear whether the insulin signaling is different from the IGF signaling, this figure treats them as the same.
This notes briefly discusses the conserved components of insulin signaling systems in fly and human. The conserved components were identified by literature search.
|
DILP and Insulin
-
DILP is an acronym of (Drosphila Insulin-Like Peptide). In
drosophila genome, seven DILPs have identified based on sequence
homology. DILP1-7 are structurally similar to preproinsulin, with
a predicted signal peptide, B chain, C peptide, and A chain.
DINR and Insulin receptor
DINR stands for Drosophila Insulin Receptor.CHICO and IRS
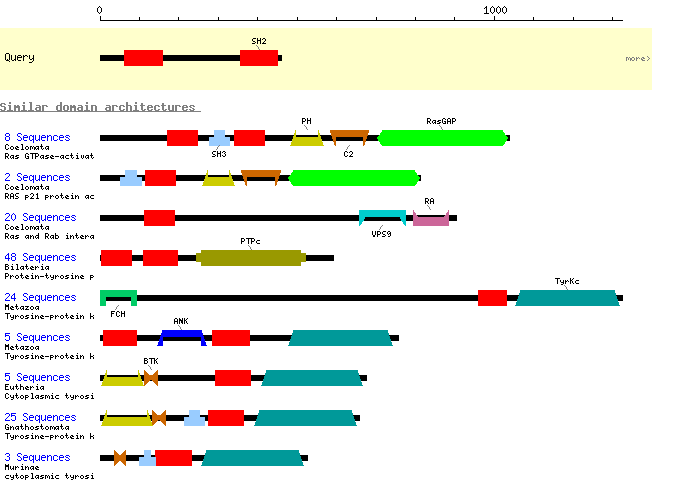
CHICO is an adaptor protein and it binds to DINR. CHICO is a protein of 968 residues long. It contains an N-terminal PH domain, PTB domain , and a C-terminal region containing multiple potential tyrosine phosphorylation sites. The PTB domain binds to phosphotyrosine residues in INR , whereas phosphorylated C-terminal tyrosine residues within the consensus Tyr-X-X-Met are thought to bind to the Drosophila class Ia phosphoinositide 3-kinase adaptor, p60.
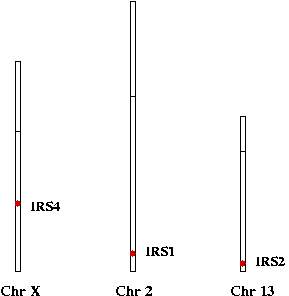
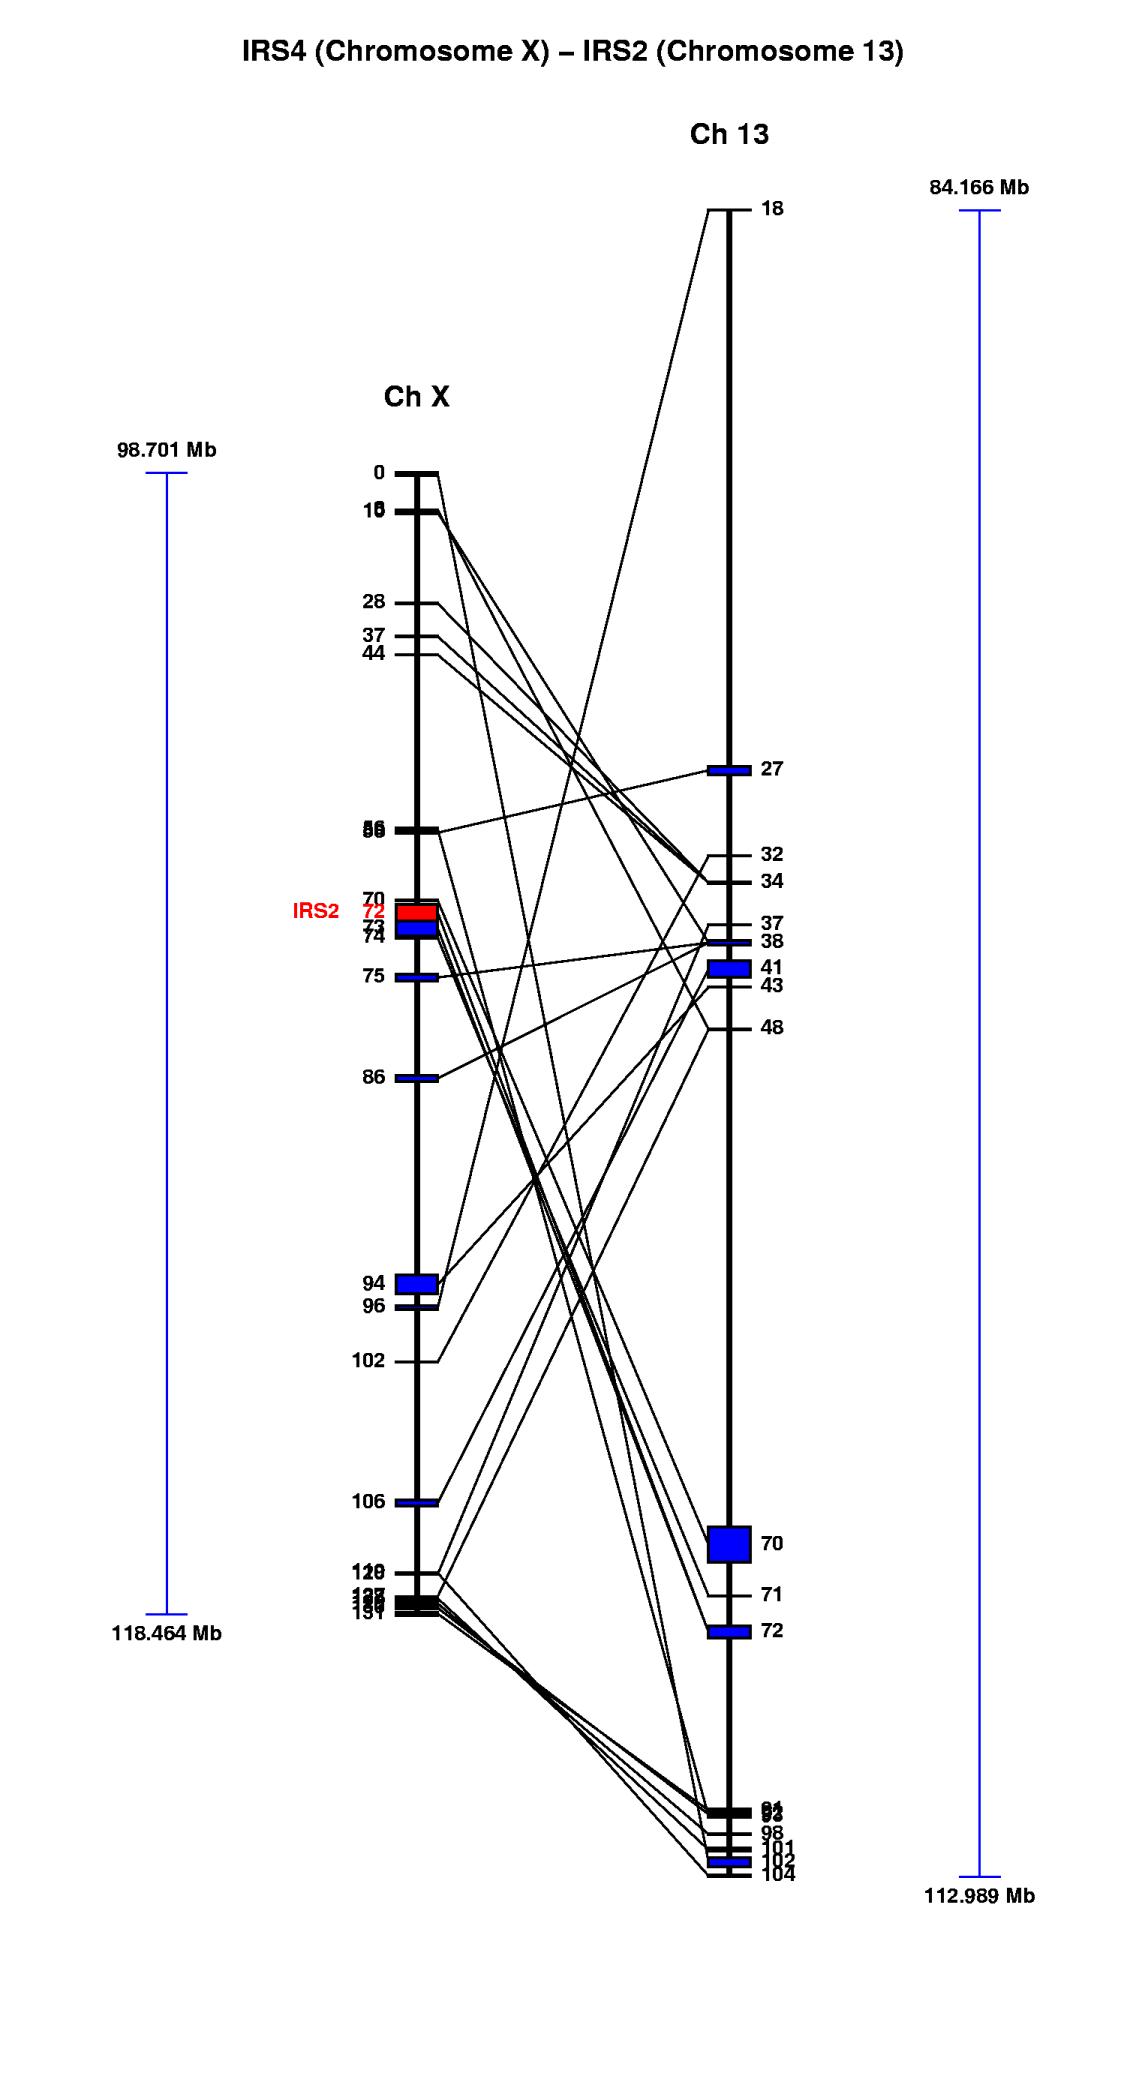
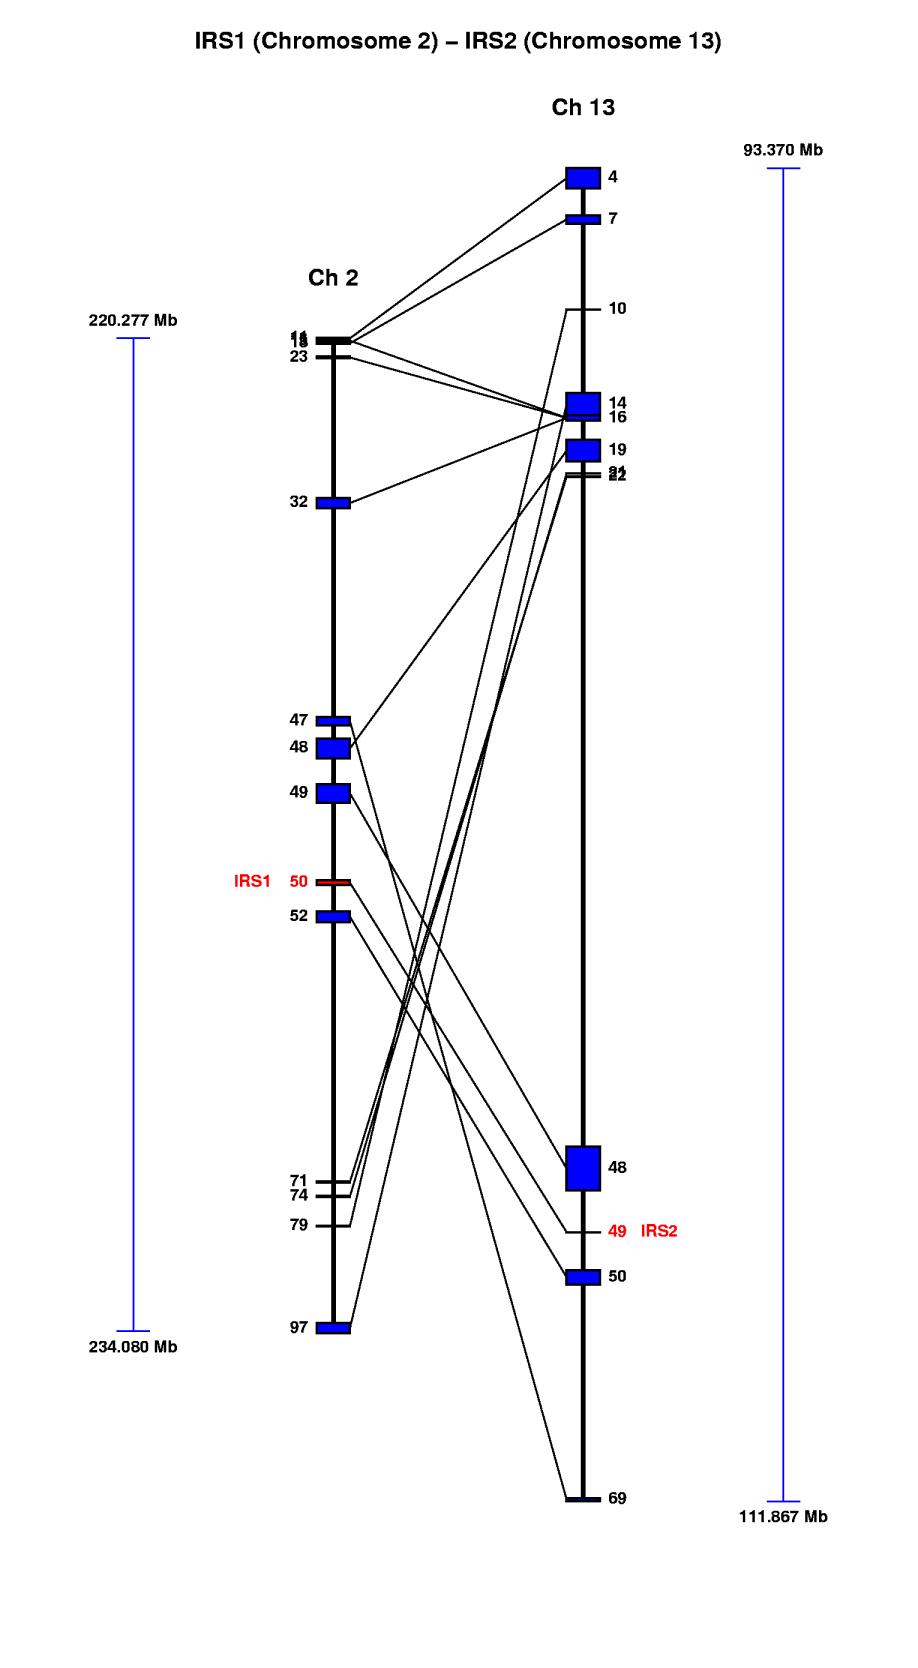
CHICO is the Drosophila homolog of mammalian Insulin Receptor Substrate (IRS) proteins( PH domain and PTB domain (IRS-1 type) ). Although, there are four IRS proteins in human genome, only IRS1 and IRS2 are known to play role in insulin signaling. ( IRS1 - Chr 2, IRS2 - Chr 13, IRS3 - Chr 12 and IRS4 - Chr X).
P60 and P85 gamma
P60 in fly is an SH2 domain-containing adaptor molecule that binds to the Drosophila class Ia phosphoinositide 3 kinase, Dp110. p60 shares sequence homology with mammalian p85alpha, p85beta, and p55PIK. p60 contains two SH2 domains that recognize phosphorylated tyrosine residues within the consensus Tyr-X-X-Met, and an inter-SH2 domain region through which it interacts with Dp110.
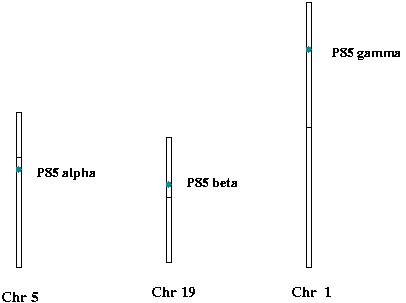
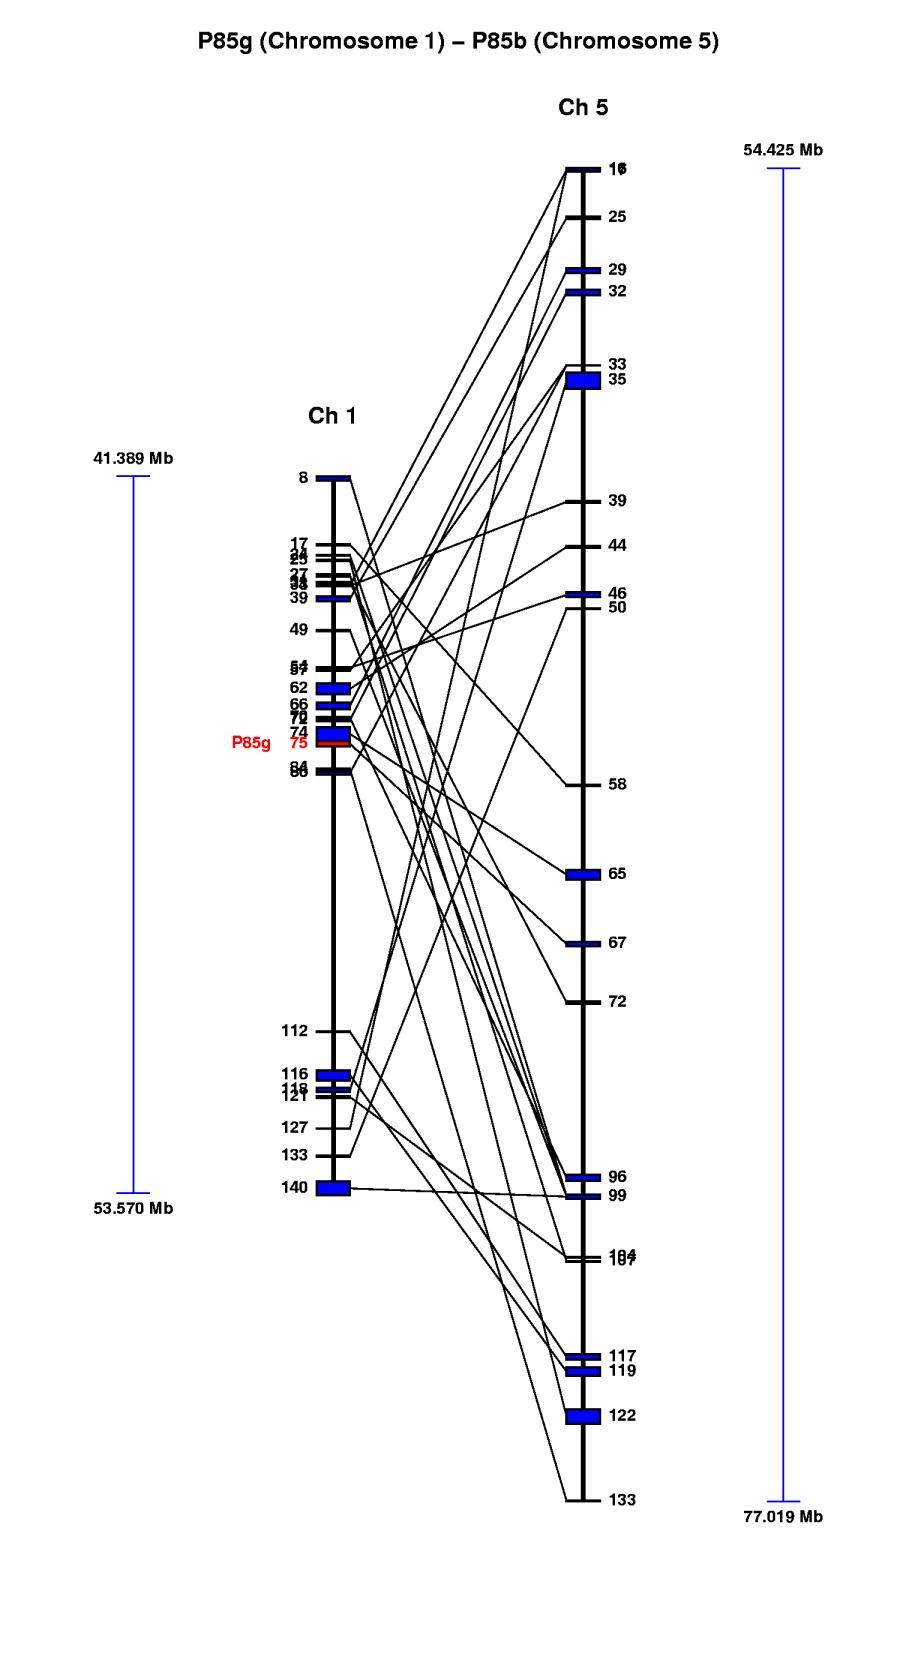
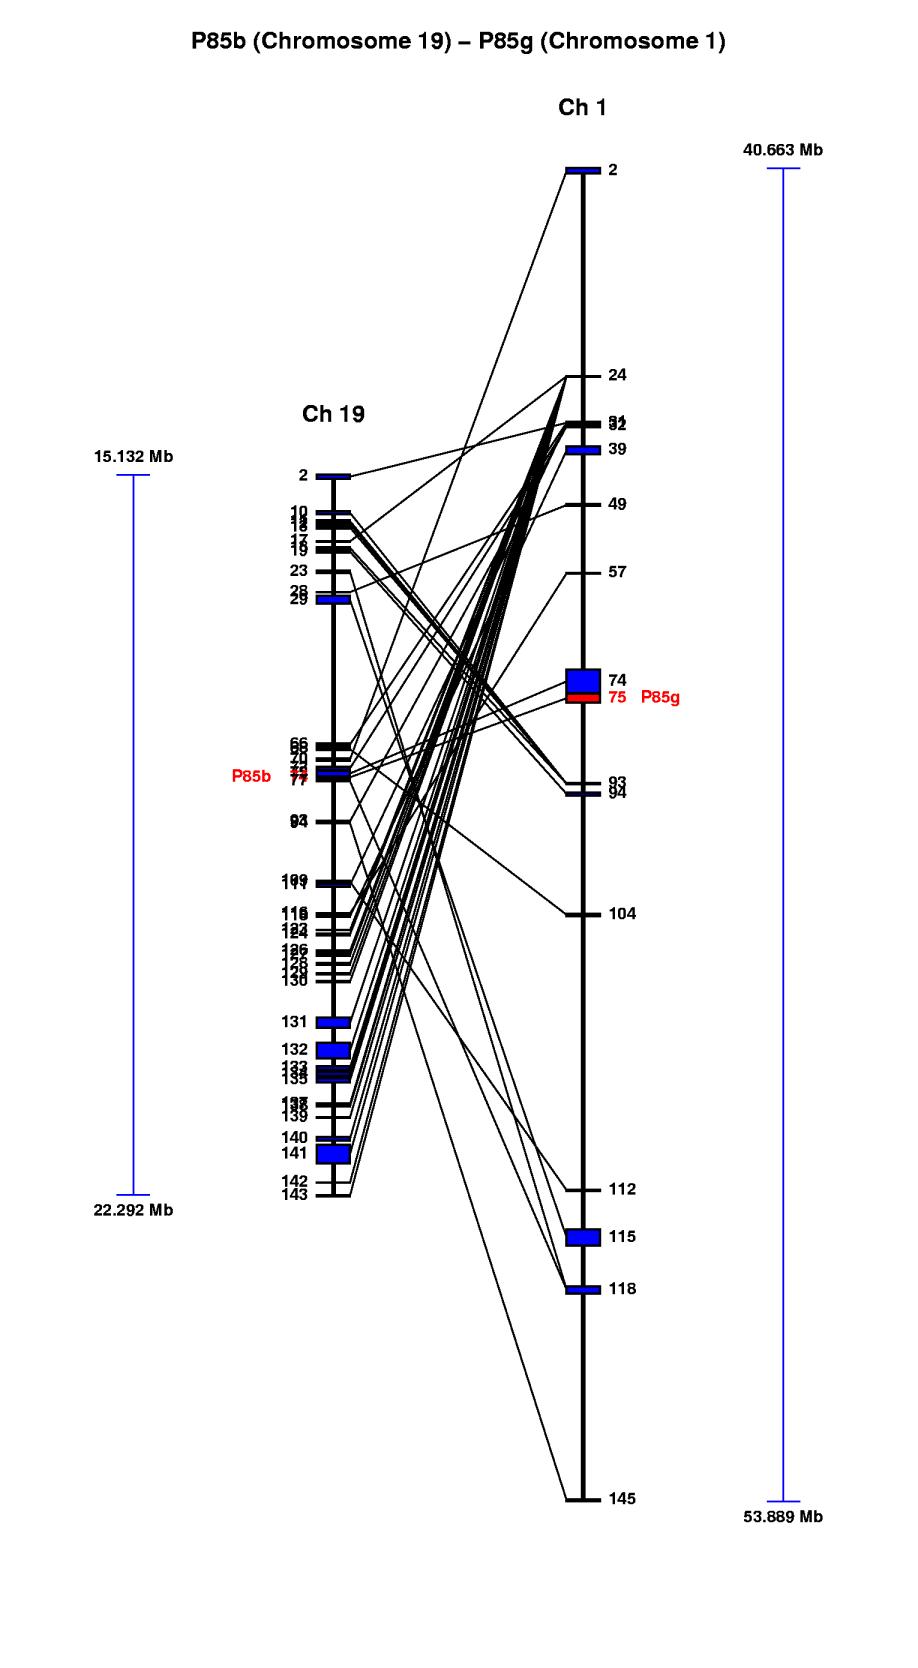
The mammalian homologs of P60 are P85alpha (Chr 5), P85beta (Chr 19) and P85gamma (Chr 1). The full names of these human proteins are Phosphatidylinositol 3-kinase regulatory alpha/beta/gamma subunit (PI3-kinase p85-alpha/beta/gamma subunit) (PtdIns-3-kinasep85-alpha/beta/gamma). The STKE connection map lists p85gamma in the insulin signaling pathway. I need find out the roles of P85alpha and P85beta.
DP110 and P110alpha
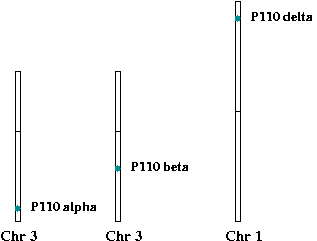
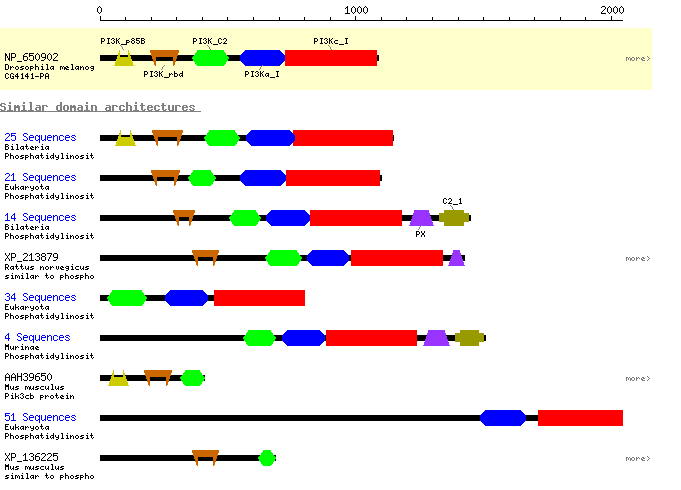
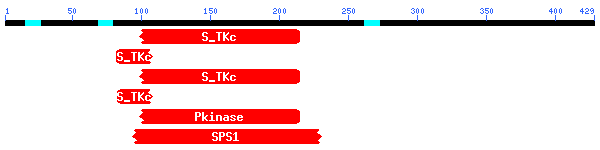
Dp110 is the Drosophila class Ia phosphoinositide 3-kinase and contains an N-terminal domain predicted to bind to the SH2 domain-containing adaptor molecule, p60, a Ras-binding domain, a C2 domain, an alpha-helical PIK domain and a catalytic domain. Dp110 possesses phosphoinositide 3-kinase activity and, in vitro, can phosphorylate PI to generate PI(3)P, PI(4)P to generate PI(3,4)P2, and PI(4,5)P2 to generate PI(3,4,5)P3. By analogy with mammalian class Ia phosphoinositide 3-kinases, PI(3,4,5)P3 is thought to be the major product of Dp110 in vivo. Mammalian homologs of Dp110 are p110alpha, p110 beta, p110delta.
The p110 catalytic subunits of class Ia phosphoinositide 3-kinases (PI3Ks) form stable heterodimeric complexes with p85 family regulatory subunits. These proteins all have N-terminal regions that mediate binding to the regulatory subunit, followed by a Ras binding domain, a C2 domain, an alpha-helical phosphoinositide kinase domain, and a catalytic domain. p110 Class Ia phosphoinositide 3-kinase catalytic subunits have the following components: