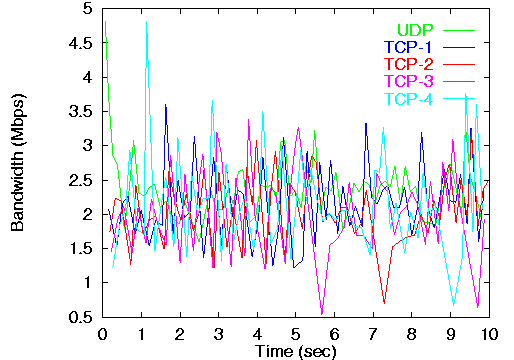

The table below shows the average throughput of each flow along the link.
Flow Avg. Throughput (Mbps) UDP 2.2464 TCP-1 1.9931 TCP-2 1.8822 TCP-3 1.7484 TCP-4 1.8978
Nodes
Links
Link
Type
Capacity (Mbps)
Link Delay (ms)
Output Bufer (bytes)
Min. Thresh. (bytes)
Max. Thresh. (bytes)
Max. Pkt. Size (bytes)
Ka (ms)
Kf (ms)
edge
(node_1->node_2)
CSFQ
10
1
64000
-
-
1000
100
100
yes
(node_2->node_1)
CSFQ
10
1
64000
-
-
1000
100
100
yes
Flows
Flow
Source
Sink
Type
TCP type
Pkt. Size (bytes)
Wnd. Size (pkts)
Rate (kbps)
Start Time (sec)
Finish Time (sec)
UDP
node_1
node_2
UDP
-
1000
-
10000
0
10
TCP-1
node_1
node_2
TCP
Tahoe
1000
20
-
0
10
TCP-2
node_1
node_2
TCP
Tahoe
1000
20
-
0
10
TCP-3
node_1
node_2
TCP
Tahoe
1000
20
-
0
10
TCP-4
node_1
node_2
TCP
Tahoe
1000
20
-
0
10