Network Designer (NetDes)
Click here to start
the applet. For the documentation please read below.
- Overview
- Add (Create) Object
- Update Object
- Delete Object
- Load Examples
- Simulation
- Limitations
- Supported Platforms and Known Bugs
1. Overview
The Network Designer (NetDes, for short) is a Java applet which
allows to interactively design simple communication networks and
simulate them in ns-2. The goal is to give
the user possibility to compare the performances of Core-Stateless
Fair Queueing (CSFQ)
to other buffer management and scheduling disciplines, such as Random
Early Detection (RED), Flow Random Early Drop (FRED) and Deficit Round
Robin with dropping from the longest queue (DRR). A comparison of
these disciplines is given in Table 1, where n represents the
total number of flows.
| |
Time Complexity |
Space Complexity |
Congestion Control Support |
Comments |
| FIFO |
O(1) |
O(1) |
no |
- |
| RED |
O(1) |
O(1) |
no |
- |
| FRED |
O(1) |
O(n) |
yes |
- |
| DRR |
O(log n) |
O(n) |
yes |
Implements Fair Queueing |
| CSFQ |
O(1) |
O(n) - edge node
O(1) - core node |
yes |
Approximates Fair Queueing |
Table 1. Disciplines that can be simulated with NetDes.
1.1. Architecture
As any web application this is a client-server application. The client
runs NetDes, which provides a friendly user interface to design simple
networks. The server runs a dispatcher process that handles client
requests by invoking ns-2 to simulate user's networks. The overall
architecture is shown bellow.
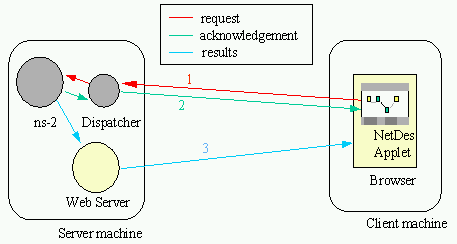
Figure 1. System architecture.
A typical client/server interaction consists of three steps:
Once the network design is completed, the user starts
simulation by clicking on the Execute button (see Section 6 ). As a result a request containing
all the relevant information about user's network is transmitted to
the dispatcher process. In turn the dispatcher creates a
corresponding tcl file that describes the network topology and invokes
ns-2.
When the simulation completes, the dispatcher assembles
the results into a web page, and acknowledges the user by sending back
the address of this web page.
By using the returned address, the user loads the result
page through her/his browser.
1.2. User Interface
NetDes manipulates three types of
objects: nodes, links, and flows. All links are
duplex and all flows are unicast. Figure 2 shows the NetDes user
interface displaying a simple network consisting of two nodes (node_1
and node_2), one link, and five flows (UDP, TCP-1, TCP-2, TCP-3, and
TCP-4).

Figure 2. The NetDes user interface.
The editor has three modes. Each mode is activated by making the
corresponding selection in Control Area. The three modes are:
- Add - create a new object. The object type is specified by
the selection at the right-hand side of Add, i.e., node,
link, or flow. When node is selected the user
can move a node by dragging it.
- Update - update the information of an existing
object.
- Delete - delete an object. When a node is deleted all
links that are incident to the node, and all flows that have either
the source or the sink at that node are also deleted.
The window located at the right-hand side of the Control Area is
called Information Window. In the Add mode, this window
displays the next action to be performed. In the Update and Delete
modes, the Information Window indicates the current object as the user
moves the pointer.
Action Area contains usually three buttons. However, if the
browser allows a Java applet to write on your disk, then the Action
Area will display three additional buttons: Load, Save,
and Save as. This allows the user to save/load her/his
work. The three buttons which are always displayed are:
- New - delete the current network.
- Load Examples - load one of the network examples which
come with NetDes.
- Execute - simulate the network that is currently displayed
in the Drawing Area.
The next sections describes in detail how to design and simulate a
network.
2. Add (Create) Object
An object can be a node, link, or flow. This section describes how to
create a new object.
2.1. Create Node
The steps to create a new node are the followings:
Select Add and node in the Control Area (see
Figure 2).
Move the pointer over the Drawing Area at the location you
wish to create the node and click the left-button of the mouse.
As a result a dialog box pops up asking for the node
label/name. Fill the name you wish and press "OK".
2.2. Create Link
In NetDes all links are duplex. Thus, when a link is created the user
needs to specify parameters in both directions, more precisely, the
buffer management and/or the scheduling discipline employed by the
output queue of each end node and the capacity of the link in each
direction. The steps to create a new link are given below.
Select Add and link in the Control Area.
Click over the node from which you want the link to start. As a
result the following dialog pops up.
The parameters in this dialog box are associated to the output queue
of the selected node, and they are:
- Scheduler type
- the type of scheduler and/or the buffer
management policy employed by the output queue. Current supported
types are FIFO, RED, FRED, FREDL, CSFQ, and DRR.
- Rate (Mbps)
- the capacity of the output link.
- Delay (ms)
- the propagation delay along the link.
- Buffer size (bytes)
- the size of the output buffer.
- Max. packet size (bytes)
- the maximum packet size along
the link. This parameter together with Buffer size are used to
express the size of the output buffer in terms of the number of
packets of maximum size that can be stored. More precisely the output
buffer capacity in packets is computed as (Buffer size) /
(Max. packet size).
- Ka - fair rate const. (ms)
- the constant used to estimate
the fair rate along the outgoing link. This parameter is used only by
CSFQ.
- Kf - flow rate const. (ms)
- the constant used to estimate
the rate of the incoming flows. This parameter is used only by CSFQ.
- Trace link's traffic
- the flag that indicates whether
the traffic on the outgoing link is to be traced. Only the results for
the marked links will be returned.
- Edge node
- the flag that indicates whether the outgoing
link belongs to an ingres node (at the edge of the cloud or not). This
parameter is used only by CSFQ.
In addition, the following parameters are specific to RED and FRED(L):
- Min. threshold (bytes)
- the output buffer minimum
threshold. When the average queue length exceeds this threshold
packets start to be probabilistically dropped.
- Max. threshold (bytes)
- the output buffer maximum
threshold. When the average queue length exceeds this threshold all
incoming packets are being dropped.
Select the second end-node of the link. As a result an
identical dialog box pops up. The parameters in this dialog box are
associated to the output queue of the second node.
Thus, while the first dialog box specifies the parameters associated to
the simplex link from the first to the second node, this dialog box
specifies the parameters of the simplex link from the second to the
first node.
2.3. Create Flow
Flows are of two types: UDP and TCP. The steps to create
a flow are the followings.
Select Add and Flow in the Control Area.
Select the node to be the source of the flow. As a result
the following dialog box pops up.
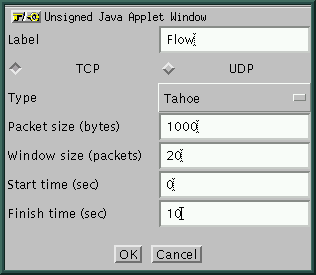
The meaning of the parameters in this dialog box is the following:
- Label - the label/name to identify the flow. This name
will be associated to both source and the sink of the flow.
- TCP/UDP - the flags that specifies the type of the flow:
UDP or TCP.
- Packet size (bytes) - the size of the flow's packets. In
the current implementation all packets of a flow have the same length.
- Window Size (packets) or Rate (Kbps) - the window
size if the flow is TCP, and the transmission rate of the source if
the flow is UDP. The interdeparture time between UDP's packets is
uniformly distributed between 0.5 and 1.5 of the average value.
- Start time (sec) - the time when the flow becomes backlogged,
i.e., when the first packet of the flow is sent.
- Finish time (sec) - the time when the flow becomes
un-backlogged, i.e., when the last packet of the flow is sent.
Select flow's destination node.
3. Update Object
3.1. Update Object Information
The steps to update the information associated to an object are given
below:
Select the Update mode in the Control Area.
Select the object you want to update by clicking on it. As
a result a dialog box will show up. Set the desired values and then
press "OK".
While in the Update mode, the Information Window in the
Control Area shows the object which will be selected if you press the
left mouse button. The node and flow objects are identified by their
labels. A link is identified by the two end nodes. The order in which
these nodes appear is important. For example, in Figure 2, (node_1 -> node_2) identifies the
simplex link from node_1 to node_2 and the corresponding output queue
of node_1. Link (node_1 -> node_2) is selected when you are
closer to node_1, while (node_2 -> node_1) is selected when you
are closer to node_2.
3.2. Update Object Position
In the current implementation only the node position can be
changed. The flows' and links' positions are automatically computed
based on the nodes' positions and the order in which they were
created.
To move a node perform the following steps.
Select Add and node in the Control Area.
Select the node you want to move and drag it to the new
position.
4. Delete Object
The steps to delete an object are given below:
Select Delete in the Control Area.
Select the object you want to delete by clicking on it. As
a result a dialog box asking for confirmation is displayed. If you
want to continue press "OK".
Note: When a node is deleted all flows that have either the
source or the sink at that node, as well as all incident links are
also deleted.
5. Load Examples
To load an example click Load Examples button in the Action
Area. As a result the following dialog box in which the user can
select the example, the scheduling discipline and the TCP type is
displayed.
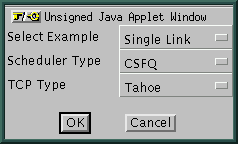
Currently there are two examples available. In both of them all links
have 10 Mbps capacity. The first example consists of a single link
shared by one UDP flow that blast at the link capacity and four TCP
flows (see Figure 2). The second example
represents a scenario in which one TCP traverses two congested links.
Each congested link is traversed by four other UDP flows, each of them
sending at twice its fair rate. The parameters associated to all links
and flows can be visualized/changed as described in Section 3.1.
6. Simulation
To simulate the network that is currently displayed in the Drawing
Area the user needs to perform the following steps:
Click Execute button in the Action Area. As a
result a dialog box containing the list of all (simplex) links in your
topology is displayed. An example is shown below.
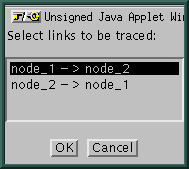
You can select one or more links to be traced. As an example, above
only the link (node_1 -> node_2) will be traced. Then click "OK".
Once you select "OK" you have to wait until the simulation
is completed. Depending on the size of the network the simulation may
take up to several minutes. Once the simulation is completed,
you will get the address of the web page containing the results as
shown below:
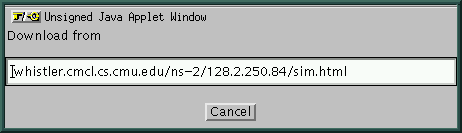
Note that you need to copy this address and use explicitly your
browser to download it. When you press "Cancel" the window will simply
disappear; the address is not stored anywhere else.
The result web page obtained by simulating the network shown in Figure 2, which is the Single Link example using
the CSFQ discipline, is shown here.
In general, the result web page gives for each traced link the
following information:
- The average bandwidth of each flow along that link.
- A plot representing the throughput of each flow along the link.
In addition, the web page shows the parameters associated to all links
and flows in the simulated network.
7. Limitations
Since currently we perform simulation on one machine, to limit the
simulation time we have imposed the following limits:
- The link capacity cannot exceed 45 Mbps.
- The flow rate cannot exceed 10 Mbps. (This limit applies to UDP only.)
- The duration of a flow cannot exceed 20 seconds simulation time.
In addition, for simplicity many of the parameters that can be set in
ns-2 are left out. For example, in the TCP case only the window size
and the type can be set.
Finally, as described in Section 4, when designing a network only the
nodes can be moved around. The positions of flows and links are
implicitly determined by the nodes' positions.
8. Supported Platforms and Known Bugs
NetDes was tested on the following configurations:
- FreeBSD 2.7, NetBSD 1.2.1, and Solaris (SunOS 5.5) with Netscape
3 and Navigator 4.05
- AIX 2.3 with Netscape 3.
- Windows NT 4.0 with both Navigator 4.05 and Microsoft Explorer
3.0/4.0
Following is the list of known bugs or inconsistent behaviors:
- With AIX 2.3 and Navigator 3.0, the fonts are not correctly
displayed. Also, when dialog boxes are displayed the "OK" button is
not visible. To correct this you need to stretch the dialog box on the
horizontally until you see the "OK" button.
- With Windows NT 4.0 and Explorer 4.03 the first object on the
dialog box may not be displayed. To correct this you need to stretch
the dialog box vertically.
- With Windows NT 4.0 and Navigator 4.05 the applet terminates
occasionally after the results are returned. This makes impossible to
go back, change the topology, and then re-run the simulation. We do not
have a fix for this problem yet.
Ion Stoica
Last modified: Sat Oct 31 11:09:36 EST 1998