Results on R2001(Industry part) data (313 categories
in training set vs 350 categories in test set)
3.1 KNN on 2001i
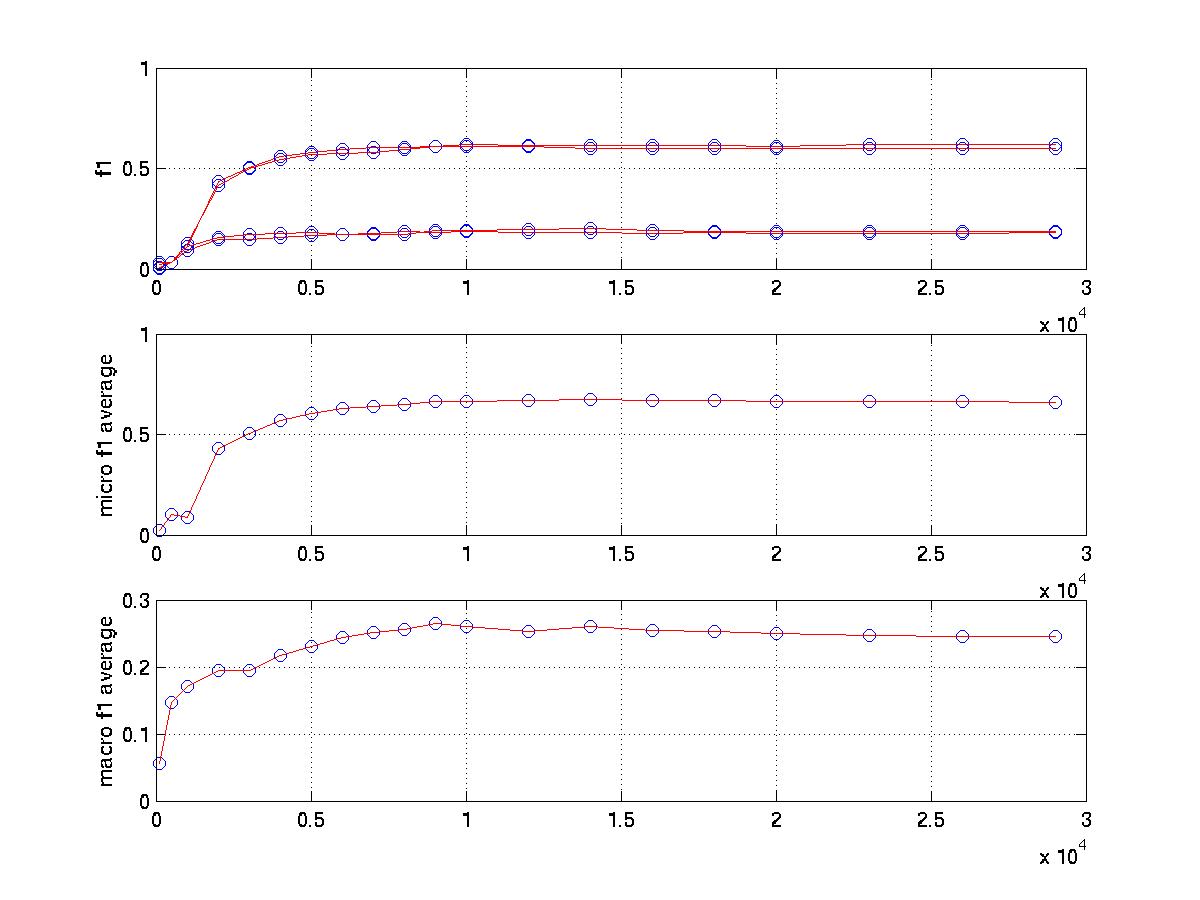
The
graph tuning feature selection number (10000 is good for both
micro and macro avg. performance)
The
graph tuning fbr value (0.4 is good for micro avg. performance
and 0.1 for macro avg. performance)
The
graph tuning knn_k value (10 is good for both micro and macro
avg. performance)
micro
avg. F1 Result and macro
avg. F1 Result
3.2 Rocchio on 2001i
The
graph tuning feature selection number (10000 is good for both
micro and macro avg. performance)
The
graph tuning beta value (-2 is good for micro avg. performance
and -6 for macro avg. performance)
The
graph tuning fbr number (0.4 is good for micro avg. performance
and 0.1 for macro avg. performance)
micro
avg. F1 Result and macro
avg. F1 Result
3.3 NB on 2001i
micro avg. F1 Result and macro avg. F1 Result
(For micro avg
result, we used 10000 top features and rcut with r=1. For macro avg.
result, we used 10000 top features and scut with s tuned. fbr=0)
It
need be mentioned that using scut with s tuned will not necessarily
optimize micro avg. result. In some rare situation, it will do bad.
Here is an example.
3.3 SVM on 2001i
The
graph tuning feature selection number (No feature selection is
needed)
The graph tuning
fbr number (0.4 is good for both micro avg. performance and 0.2
for macro avg. performance)
micro
avg. F1 Result and macro
avg. F1 Result
Conclusion: