CARNEGIE MELLON UNIVERSITY
15-826 - Multimedia databases and data mining
Spring 2008 - C. Faloutsos
Homework 1 - Due: Tuesday Feb. 5, 1:30pm,
in class.
Important:
- Due date: Tuesday Feb. 5, 1:30pm, hard copy in class and
soft copy e-mailed to the TA (htong
at cs) in a single e-mail.
- This
homework is MANDATORY, meaning you must get at least a passing
grade: 50 points or higher.
- For
all questions please BOTH:
- e-mail the TA (htong at cs)
a soft-copy of all code, output and auxilary scripts tar'ed up in a
single file
- hand in a hard-copy of all code, output and auxilary scripts
- Please
turn in a typed report
- handwritten material may not be graded, at the grader's
discretion.
- All
homeworks including this are to be done INDIVIDUALLY
- Expected
effort for this homework (approximate times):
- Q1: 1 hour
- Q2: 15 hours: 6 hours for 2.1, 6h for 2.2, and 3 hours for 2.3.
- Q3: 6
hours: 3 hours for 3.1, and 3 hours for 3.2
Q1: SQL [30pts]
Problem Description. Retrieve the following tables and load them in a DBMS of your choice: MS-Access is recommended, but any other is acceptable (eg., MySQL, postgres, etc). Caution: The ASCII data files have windows end-of-line termination. For unix/linux use "dos2unix" to convert them.
Tables:
- MOVIE
(title, year, type)
- PLAY_IN (first_name, last_name, title)
- ACTOR (first_name, last_name, gender)
- Rating (title, rating)
The tables are comma-separated ASCII files. Note that in ‘Rating’ table, we have omitted the user-id. So, you might find that some movies have been rated multiple times with the same rating. The rating values range from 1 to 5 (5 being the best). Answer the following queries:
Q.1.1. [5 pts] List all movie titles where “Tom Cruise” has played.
|
SELECT title FROM playin WHERE first_name
= 'Tom' and
last_name = 'Cruise' |
|
|

Comment: the result on the old dataset is also fine.
Q.1.1. [5 pts] List the title of popular movies, that is, whose rating is great than 4 (>4) as well as their average ratings. Order the results by their average rating (from highest to lowest).
Clarification: we want to find the title as well
as the average rating for those popular movies. And here, a popular movie is
defined as the one whose average rating is great than 4.
|
SELECT title, avg(rating) FROM rating GROUP BY title HAVING
avg(rating)>4 ORDER BY
avg(rating) DESC |
|
|

Q.1.2. [10 pts] List the actors (first_name, last_name) and titles of movies, which are produced before 1960 and whose type is 'TV'.
|
SELECT
playin.first_name, playin.last_name, movie.title FROM playin,
movie WHERE movie.title
= playin.title and movie.year
< 1960 and movie.type = 'TV' |
|
|

Q.1.3. [10 pts] List the actors (first_name, last_name) as well as their genders, who have played in those well discussed movies, that is, which have been rated more than 3 times (>3). Note that, here the actual ratings do not matter. So a movie that has been rated 4 times, and each time it receives a rating of 1 will still qualify.
|
SELECT
actor.first_name,actor.last_name, actor.gender FROM playin,
actor WHERE
playin.first_name = actor.first_name and
playin.last_name = actor.last_name and playin.title
in (SELECT title
FROM rating
GROUP BY title HAVING count(*)>3) |
|
|

What to hand in: for each query give
(1) the resulting tables [half of the points] and
(2)
the hardcopy of the corresponding SQL statement [half
of the points].
Fun fact: this is closely related to the NetFlix prize, which is $1M (see http://www.netflixprize.com/index).
Q2: Z-ordering for Range Query [30pts]
Q.2.1. Problem description (1-dimensional case): given a region (= segment) in 1-dimension (xlow, xhigh), break it into some homogeneous regions (i.e. one number, which consists of 1/0/*, for one such region). Here, xlow, and xhigh will be binary strings with n bits, assuming that xlow is always less or equal than xhigh. Write a program 'zrange_1d' in your favorite language that will do this job. For example, (with the usual unix/linux convention, that ‘%’ is the promp and ‘#’ is the comment symbol)
% ./zrange_1d 00 11 #xlow xhigh
**
Here, the answer ‘**’ means that it covers the whole region, which is the interval from 0 (=002) to 3 (=112). Another example is,
% ./zrange_1d 010 111 #xlow xhigh
01*
1**
Notice that in this example, the program returns two pieces and each of them is 3 characters long, indicating that the original region (010, 111) consists of two homogeneous regions.
Answer:
% ./zrange_1d 001 101
001
01*
10*
% ./zrange_1d 0100 1100
01**
10**
1100
Comment:
・ A homogeneous must satisfy the following two features: (a) xlow and xhigh agree with the prefix; and (2) the suffix of xlow must be all 0s and the suffix of xhigh must be all 1s.
・ The above claim has two exceptions: (a) a single point, where the suffix is empty and (2) the whole region where the prefix is empty.
・ Try to do it recursively based on the above two claims.
Q.2.2. Problem description (2-dimensional case): now, consider the case of
2-dimensional space. We want to break a range query (xlow, xhigh
, ylow , yhigh), into z-values. Write a program 'zrange_2d ' in your favorite language
that will do this job. Again, the four input numbers are n bits long, with the
xlow is less or equal than xhigh, and the ylow,
is less or equal than yhigh.
For example,
% ./zrange_2d 00 11
00 11 #xlow xhigh ylow yhigh
****
This means that we cover the whole area and the output has 4 ‘don’t-care’ (‘*’) characters.
% ./zrange_2d
0100 1100 0100 1100 #xlow xhigh
ylow yhigh
0011****
0110****
01110000
01110010
01111000
01111010
1001****
1011000*
1011010*
1100****
11010000
11010010
11011000
11011010
1110000*
1110010*
11110000
Observation #1: we consider ‘1110010*’ as a legitimate z-value despite the fact that it is not a square
region.
Observation #2: ‘*’ in the middle is not allowed.
Observation #3: The z-value for the (x=0,y=1) cell is 1 in decimal.
Answer:
% ./zrange_2d 01010 01010 11001 11001
0111001001
% ./zrange_2d 0001 0001 0000 1111
0000001*
0100001*
0001001*
0101001*
0000011*
0100011*
0001011*
0101011*
% ./zrange_2d 01000 10011 01000 10011
0011******
011000****
011010****
10010*****
110000****
% ./zrange_2d 0001000 0101111 0001000 0101111
00000011******
0000011*******
0001001*******
00001001******
00001011******
000011********
000110********
00100001******
00100011******
001001********
001100********
Comment:
・ Try to break this problem into two 1-d problems and then do bit-shuffling;
・ Note that we allow odd number of ‘*’ at the end. In other words, we can represent a rectangle (instead of square) region by one single z value.
・ Note that the 0s at the beginning are necessary. In other words, ‘0010’ and ‘10’ are two different regions.
Q.2.3. Given a 8×8
grid, we want to find out the region (xlow, xhigh , ylow , yhigh) that has largest number of zvalues. List the qualifying (xlow, xhigh , ylow
, yhigh) as
well as the count of its zvalues. If there is a tie, any answer is fine.
Answer: (000 111 001
110), which leads to 24 zvalues.
Comment: note that 1** is counted as 1 z-value.
What to hand in:
(1)
[16 pts] Hard copy of your program's output on the
script.
(2)
[5 pts] Hard copy of the source code for Q.2.1 and Q.2.2.
(3)
[5 pts] Email a tarfile of your source code for Q.2.1 and Q.2.2 to the TA (htong at cs). Please
include just the source code and not the binaries.
(4)
[4 pts] List the qualifying (xlow,
xhigh , ylow , yhigh) as well as the count of its zvalues. If there is a tie, any answer is
fine.
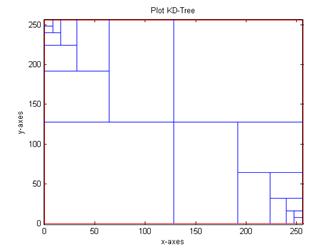
Q3: K-D-Tree [40pts]
Q.3.1 Problem
Description. Consider the k-d-tree
package, in
C, (tar xvf; make). You are required to implement ‘w’ for
dra(w)ing the current space partition that is used by k-d-tree. For example, if
you insert these
three data points (each
row is a 2-d data point) into the k-d-tree, you program should return the
following figure:

For this sub-problem,
you can assume that all data points are located within a rectangle, where
x_low=y_low = 0; and x_high=y_high = 256.
What to Hand in:
(1)
[10 pts ] the plot of space partition that is used by k-d-tree if you insert the
following points into
the tree (each row is a 2d point);
(2)
[10 pts] the plot of space partition that is used by k-d-tree if you insert the
following points into
the tree (each row is a 2d point);
(3)
[5 pts] the hard copy of your source code (please give only the parts that
you have added/ modified). Email
the tar-ball to htong at cs. Please make sure that the program correctly
compiles with make.
Answer:

Comment:
・
We can
leverage ‘p’ function to solve this problem.
・
For those
who are not familiar with c, here is the matlab package for k-d-tree
・
The related
code is as follows:
/* C
code for finding the lines */
/*
generates intervals in the tree */
void draw(TREENODE * subroot){
printf("\n0 0 256
0\n");
printf("0 0 0
256\n");
printf("256 0 256
256\n");
printf("0 256 256
256\n");
NUMBER low[2];
low[0] = 0;
low[1] = 0;
NUMBER high[2];
high[0] = 256;
high[1] = 256;
rdraw(subroot, 0, low,
high);
}
void rdraw(TREENODE * subroot, int level, NUMBER * low, NUMBER * high){
if(subroot != NULL)
{
if(level == 0)
{
printf("%g %g %g
%g\n", ((subroot->pvec)->vec)[0], low[1], ((subroot->pvec)->vec)[0],
high[1]);
}
else
{
printf("%g
%g %g %g\n", low[0], ((subroot->pvec)->vec)[1], high[0],
((subroot->pvec)->vec)[1]);
}
NUMBER
tmp = high[level];
high[level]
= ((subroot->pvec)->vec)[level];
rdraw(subroot->left,
(level + 1) % 2, low, high);
high[level]
= tmp;
tmp
= (low)[level];
low[level]
= ((subroot->pvec)->vec)[level];
rdraw(subroot->right,
(level + 1) % 2, low, high);
low[level]
= tmp;
}
}
Q.3.2. According to
Bentley in 1975, the search time in a d-dimensional
space is empirically expected to be O(log(n)), where n is the size of the dataset. The purpose of this sub-problem is to
verify this claim, and to compare the search time of k-d-trees against the time
for sequential scanning. You are
asked to randomly generate n data
points in 2d space; then, find the nearest neighbor to each of the following data
points (each row
is a data point) by k-d-tree; and compare the search time with sequential scan.
For sequential scan, if your machine is too low, you are allowed to only find
the nearest neighbor to the first data point. Make sure that you *EXCLUDE* the
time to construct the k-d-tree.
What to Hand in:
(1)
[10 pts], report plot (the search time vs. the size of the dataset) for the
two methods, where the size of the dataset n=1,000,000; 2,000,000; 4,000,000;
8,000,000; 16,000, 000. For each n,
run the experiment 10 times and report the mean search time and the ![]() 1 standard
deviation. Also, report the same plot in log-log scales.
1 standard
deviation. Also, report the same plot in log-log scales.
(2)
[5 pts] the hard copy of your script which generates the above curve.
Hints:
(1)
Ideally,
the results should be run on a dedicated machine.
(2)
If your
machine is too slow, scale down the size of the dataset n by a factor of 10
(that is n=100,000; 200,000; 400,000; 800,000; 1,600,000).
(3)
You can use
gnuplot, excel, matlab (or anything else you prefer to) to generate the plot.
For example, you can use the command ‘errorbar’ in matlab to plot the mean search time as well as its standard
deviation.
(4)
You can use
a profiler to find the CPU/running time, or the function clock() in C
(and, of course, #include
<time.h> )
Answer:
|
For
sequential scan |
|
|
Linear-linear
plot |
Log-log
plot |
|
|
|
|
For
K-D-Tree |
|
|
Linear-linear
plot |
Log-log
plot |
|
|
|


Comment:
・
The
absolute value does not matter.
・
Some
people found that the search time for K-D-tree (using clock()) is always be
0.000 because of the granuality of clock(). To avoid this, we can run the same
query multiple times and then use clock() the measure the total search time.
・
The
code for finding search time is as follows:
/* C code for finding the running time */
clock_t start = 0, finish = 0;
start = clock();
/* start your k-d-tree nn search, or sequential search here*/
finish = clock();
NUMBER duration = (NUMBER)(finish - start) / CLOCKS_PER_SEC;
printf("\n%g\n", duration);