Support Distribution Machines
Let's say we have a bunch of labeled data. Given a new set of data, we want to be able to predict its label. This is the standard machine learning problem setting of classification (if the labels are distinct classes) or regression (if the labels are continuous values).
Most algorithms to solve these problems operate by extracting feature vectors from the underlying data, and then finding regions in feature space that correspond to the classes, or smooth-ish functions in that space that match the regression problem.
For example, if you're classifying emails as spam or not spam, you might choose one feature dimension that corresponds to the number of times that the word "account" is used, another for the number of times "pharmacy" appears, another for whether the sender is in your address book, and so on.
These choices are very important: even the fanciest learning algorithm can't do anything with the wrong features, and even the simplest can often do very well with the right ones.
But sometime it's not easy to summarize your data in a single, fixed-length vector. One particular case where it's difficult: if your data is really comprised of a set of points.
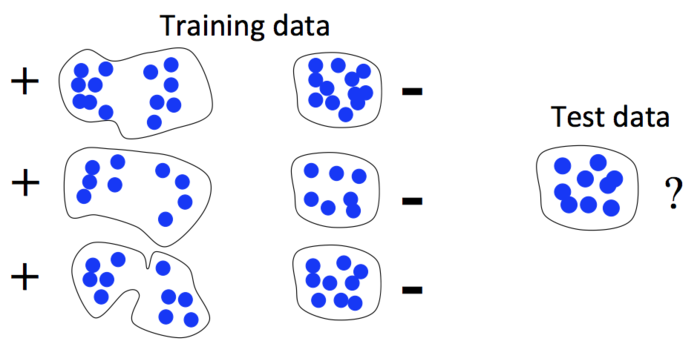
In this case, the obvious way to summarize the vectors (the mean) isn't enough for the classification. You could try coming up with some other types of summaries, but our method instead directly compares the amount by which the sets overlap. Technically, the way we do this is by treating the points as samples from some unknown probability distribution and then statistically estimating the distance between those distributions, such as the KL divergence, the closely related Rényi divergence, L2 distance, or other similar distances.
Some real-world examples where your data comes in sets:
- In astronomy, galaxy clusters are composed of individual galaxies
- Images can be treated as sets of local patches
- The set of tweets from a given area and time
- The set of internet browsing traffic from different areas of the country for a given timeframe
- The set of velocity vectors from a region of a vector field
- Something from your research! Get in touch to talk about how to frame your problem, or give it a shot yourself.
The skl-groups and py-sdm packages implement this in Python. (skl-groups is newer, better-documented, and all-around cooler, but not yet feature-complete.) More details on the method are available in some papers:
- Dougal J. Sutherland, Liang Xiong, Barnabás Póczos, Jeff Schneider (2012). Kernels on Sample Sets via Nonparametric Divergence Estimates. arXiv:1202.0302 [cs.LG]
- Barnabás Póczos, Liang Xiong, Dougal J. Sutherland, Jeff Schneider (2012). Nonparametric Kernel Estimators for Image Classification. Computer Vision and Pattern Recognition.