Calibrate the steering curvature on REC front lawn as a function of speed
Various control sequences were given to the tractor on the lawn and its position was recorded. For a number of different speeds, the tractor drove straight for 5-10 sec and then was given a curvature command of -0.2, -0.1, 0.1, or 0.2. A controller speed of 2.0 was used in the following gears to produce these speeds:
| Gear | Speed |
|---|---|
| B1 | 0.7 m/s |
| B4 | 1.2 m/s |
| C2 | 1.3 m/s |
| C4 | 1.9 m/s |
| D2 | 2.2 m/s |
| D4 | 3.1 m/s |
The figure below shows the type of data collected. The tractor was in gear C4, drove straight, and then was given a curvature command of -0.2. The points during the steady-state section of the turn (shown with the thick red line) were used to fit a circle to (thin black line), and the resulting radius was recorded.

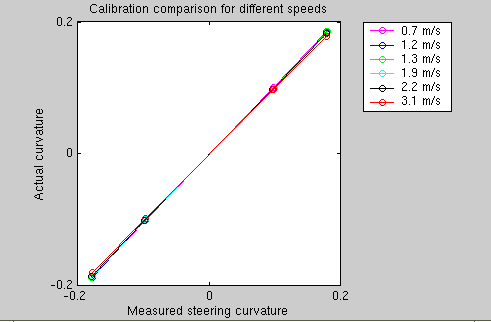
The table below shows all the raw data from these experiments. The following figure shows how good the calibration is for different speeds. It can be seen that the response matches the expected response fairly well, and the response does not vary much over different speeds. A least squares fit on this data gives an intercept of -0.0020 and a slope of 1.0334.
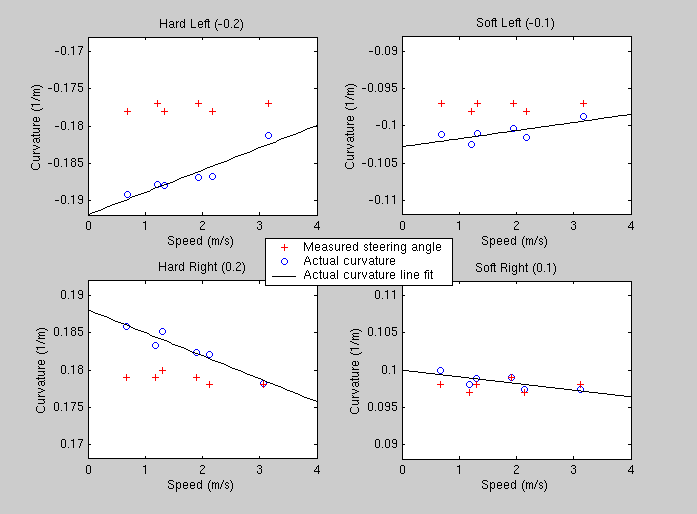
The following figure looks more carefully at the dependency on speed. Each graph is the data from one curvature setting. These graphs show several things. There is a dependency on speed, and speed affects sharper turns more, as shown by the slope of the black line fits. The actual angle of the wheels is consistently less than the commanded angle (see Dynamic Results section below). Also, since the measured steering curvature and the actual steering curvature match better on right turns than left, it appears that the calibration could be improved.
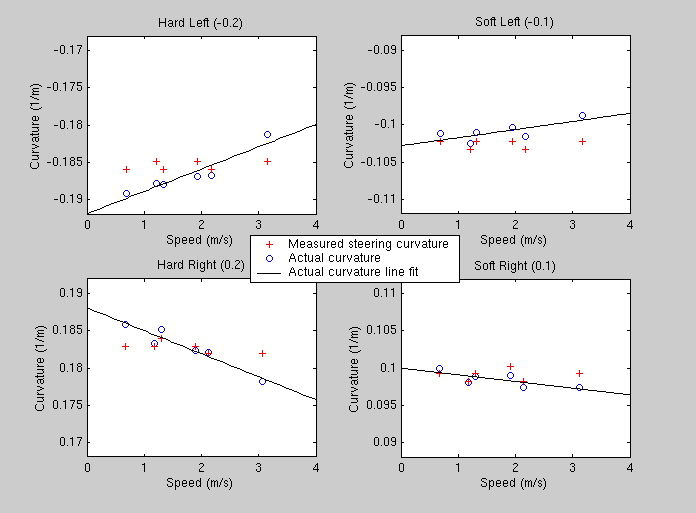
The figure below shows the same information, but the measured steering curvature values (the red +'s) have been adjusted by the least-squares fit parameters mentioned above. As expected, this improves the match between steering measurement and actual curvature.
| Command | Measured | Actual | ||
|---|---|---|---|---|
| Curvature | Speed | Curvature | Radius | Curvature |
| -0.2 | 0.692 | -0.178 | 5.285 | 0.1892 |
| -0.2 | 1.220 | -0.177 | 5.323 | 0.1879 |
| -0.2 | 1.328 | -0.178 | 5.320 | 0.1880 |
| -0.2 | 1.936 | -0.177 | 5.349 | 0.1869 |
| -0.2 | 2.179 | -0.178 | 5.354 | 0.1868 |
| -0.2 | 3.156 | -0.177 | 5.515 | 0.1813 |
| -0.1 | 0.689 | -0.097 | 9.884 | 0.1012 |
| -0.1 | 1.210 | -0.098 | 9.761 | 0.1025 |
| -0.1 | 1.326 | -0.097 | 9.899 | 0.1010 |
| -0.1 | 1.940 | -0.097 | 9.963 | 0.1004 |
| -0.1 | 2.178 | -0.098 | 9.848 | 0.1015 |
| -0.1 | 3.173 | -0.097 | 10.130 | 0.0987 |
| 0.1 | 0.672 | 0.098 | 9.999 | 0.1000 |
| 0.1 | 1.178 | 0.097 | 10.200 | 0.0980 |
| 0.1 | 1.304 | 0.098 | 10.124 | 0.0988 |
| 0.1 | 1.915 | 0.099 | 10.096 | 0.0990 |
| 0.1 | 2.139 | 0.097 | 10.269 | 0.0974 |
| 0.1 | 3.119 | 0.098 | 10.271 | 0.0974 |
| 0.2 | 0.671 | 0.179 | 5.380 | 0.1859 |
| 0.2 | 1.184 | 0.179 | 5.454 | 0.1833 |
| 0.2 | 1.297 | 0.180 | 5.400 | 0.1852 |
| 0.2 | 1.891 | 0.179 | 5.487 | 0.1823 |
| 0.2 | 2.118 | 0.178 | 5.492 | 0.1821 |
| 0.2 | 3.073 | 0.178 | 5.611 | 0.1782 |
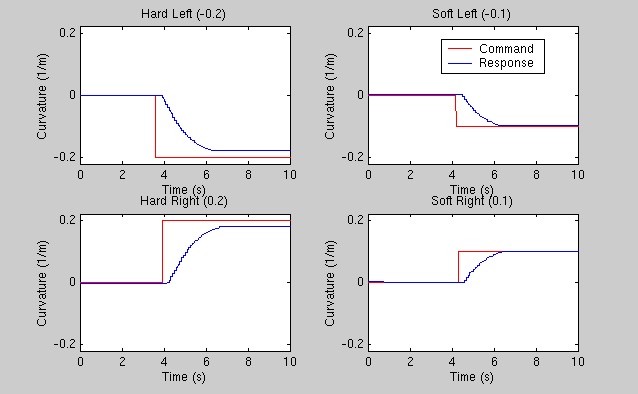
The plots below show the control law for the tractor steering, and its resulting dynamic response. The controller is a proportional controller with a small deadband and minimum/maximum control outputs. The response graph shows that there is approximately a 0.2 second delay before any motion occurs and then it responds as a first order system. The max curvature allowed is 0.188 so for the hard left/right turns, the wheels never reach the commanded value. The response curves were taken while moving at approximately 3.1 m/s, but the response is the similar at other speeds as well.

Some of the same tests as in Section Steady-State Results were performed at the Gascola test site. The gravel/dirt terrain at Gascola offers good grip, so the tractor performed similarly. The graphs below show that even at over 3 m/s during a full left turn, the tractor's trajectory only changes by around 10cm over the different terrain materials.
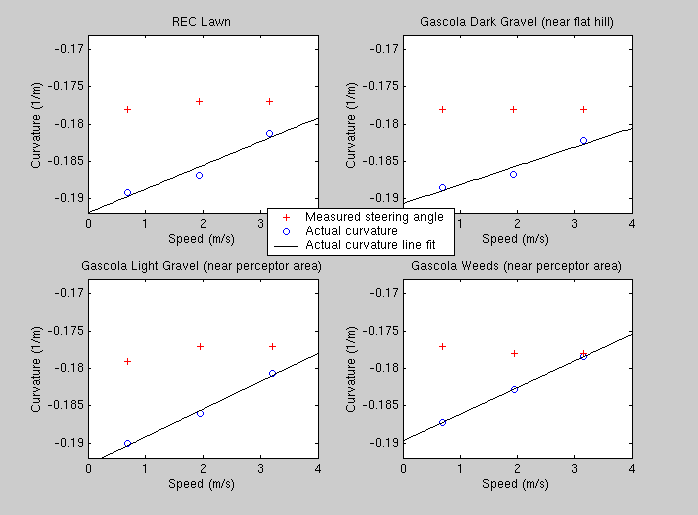
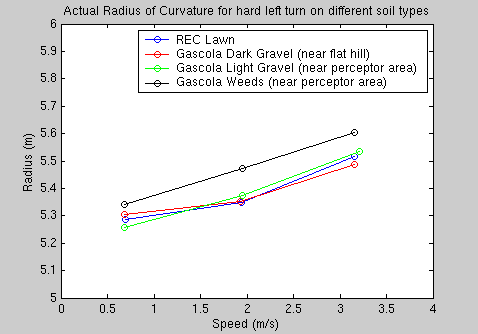
| Command | Measured | Actual | ||
|---|---|---|---|---|
| Curvature | Speed | Curvature | Radius | Curvature |
| REC Lawn | ||||
| -0.2 | 0.692 | -0.178 | 5.285 | 0.1892 |
| -0.2 | 1.936 | -0.177 | 5.349 | 0.1869 |
| -0.2 | 3.156 | -0.177 | 5.515 | 0.1813 |
| Gascola Dark Gravel (near flat hill) | ||||
| -0.2 | 0.682 | -0.178 | 5.305 | 0.1885 |
| -0.2 | 1.929 | -0.178 | 5.353 | 0.1868 |
| -0.2 | 3.161 | -0.178 | 5.487 | 0.1822 |
| Gascola Light Gravel (near perceptor area) | ||||
| -0.2 | 0.686 | -0.179 | 5.259 | 0.1901 |
| -0.2 | 1.954 | -0.177 | 5.373 | 0.1861 |
| -0.2 | 3.205 | -0.177 | 5.534 | 0.1807 |
| Gascola Weeds (near perceptor area) | ||||
| -0.2 | 0.685 | -0.177 | 5.341 | 0.1872 |
| -0.2 | 1.952 | -0.178 | 5.471 | 0.1828 |
| -0.2 | 3.151 | -0.178 | 5.604 | 0.1784 |
In general, it seems that the steering angle is a good predictor of the path of the vehicle across different speeds and different terrain types. I believe this will not hold in muddy conditions, but more testing is needed.