The figures below show the results of the study. There were 67 subjects in all and they each had a total of 8 utterances to listen to. This gives us a total of 536 tokens. From this, as mentioned above, there was one response that was eliminated due to a distraction.
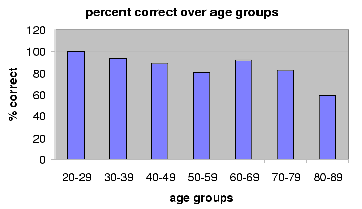
Figure 1 shows how, over all of the conditions combined, hearing decreases with age (decrease being defined as a lower percentage of correct scores). The x axis represents the age groups and the y axis represents the percent correct. We can see that as people get older, their hearing in general decreases.
We then looked at the results for the eight different categories over all speakers. This is shown on Figure 2. The x axis represents the different conditions and the y axis again represents percent correct responses. We have shaded the natural speech bars in a light color and the synthetic speech in a darker color.
We can see here that synthetic speech was in general harder to understand than natural speech. We can also see that "time", with its reduced semantic and lexical possibilities, was correct more often than "words" within the same condition. We note that the recorded speaker's attempts to be better understood in the NS conditions did not meet with better success in general than the natural speech NN condition. This may be because this speaker chose to speak much louder, instead of inserting pauses, or increasing F0 emphasis. It is well known that increasing amplitude does not make speech much easier to understand for older listeners. Their problems concern attention, thus such elements as pauses and F0 placement serve to attract their attention to specific high-content words.

We also looked at more specific aspects of the data shown in the above two figures. Figure 3 shows a breakdown of the results with different conditions (categories) as a function of the age groups. We see that while understanding of synthetic speech rapidly decreases, natural speech remains understandable much longer.

We also broke results down in Figure 4 to show the age groups as a function of the different conditions. We note that in almost all cases, as expected, times are easier to understand than words. However, for the SN case of purely synthetic speech, this is not always true. This implies that natural prosody actively helps people to understand speech. It would also seem, from our data, that at about the age of 80, comprehension declines greatly over all conditions
The correlation between age and percentage correct is -0.33, that is, the older the person, the less they understand.
