|
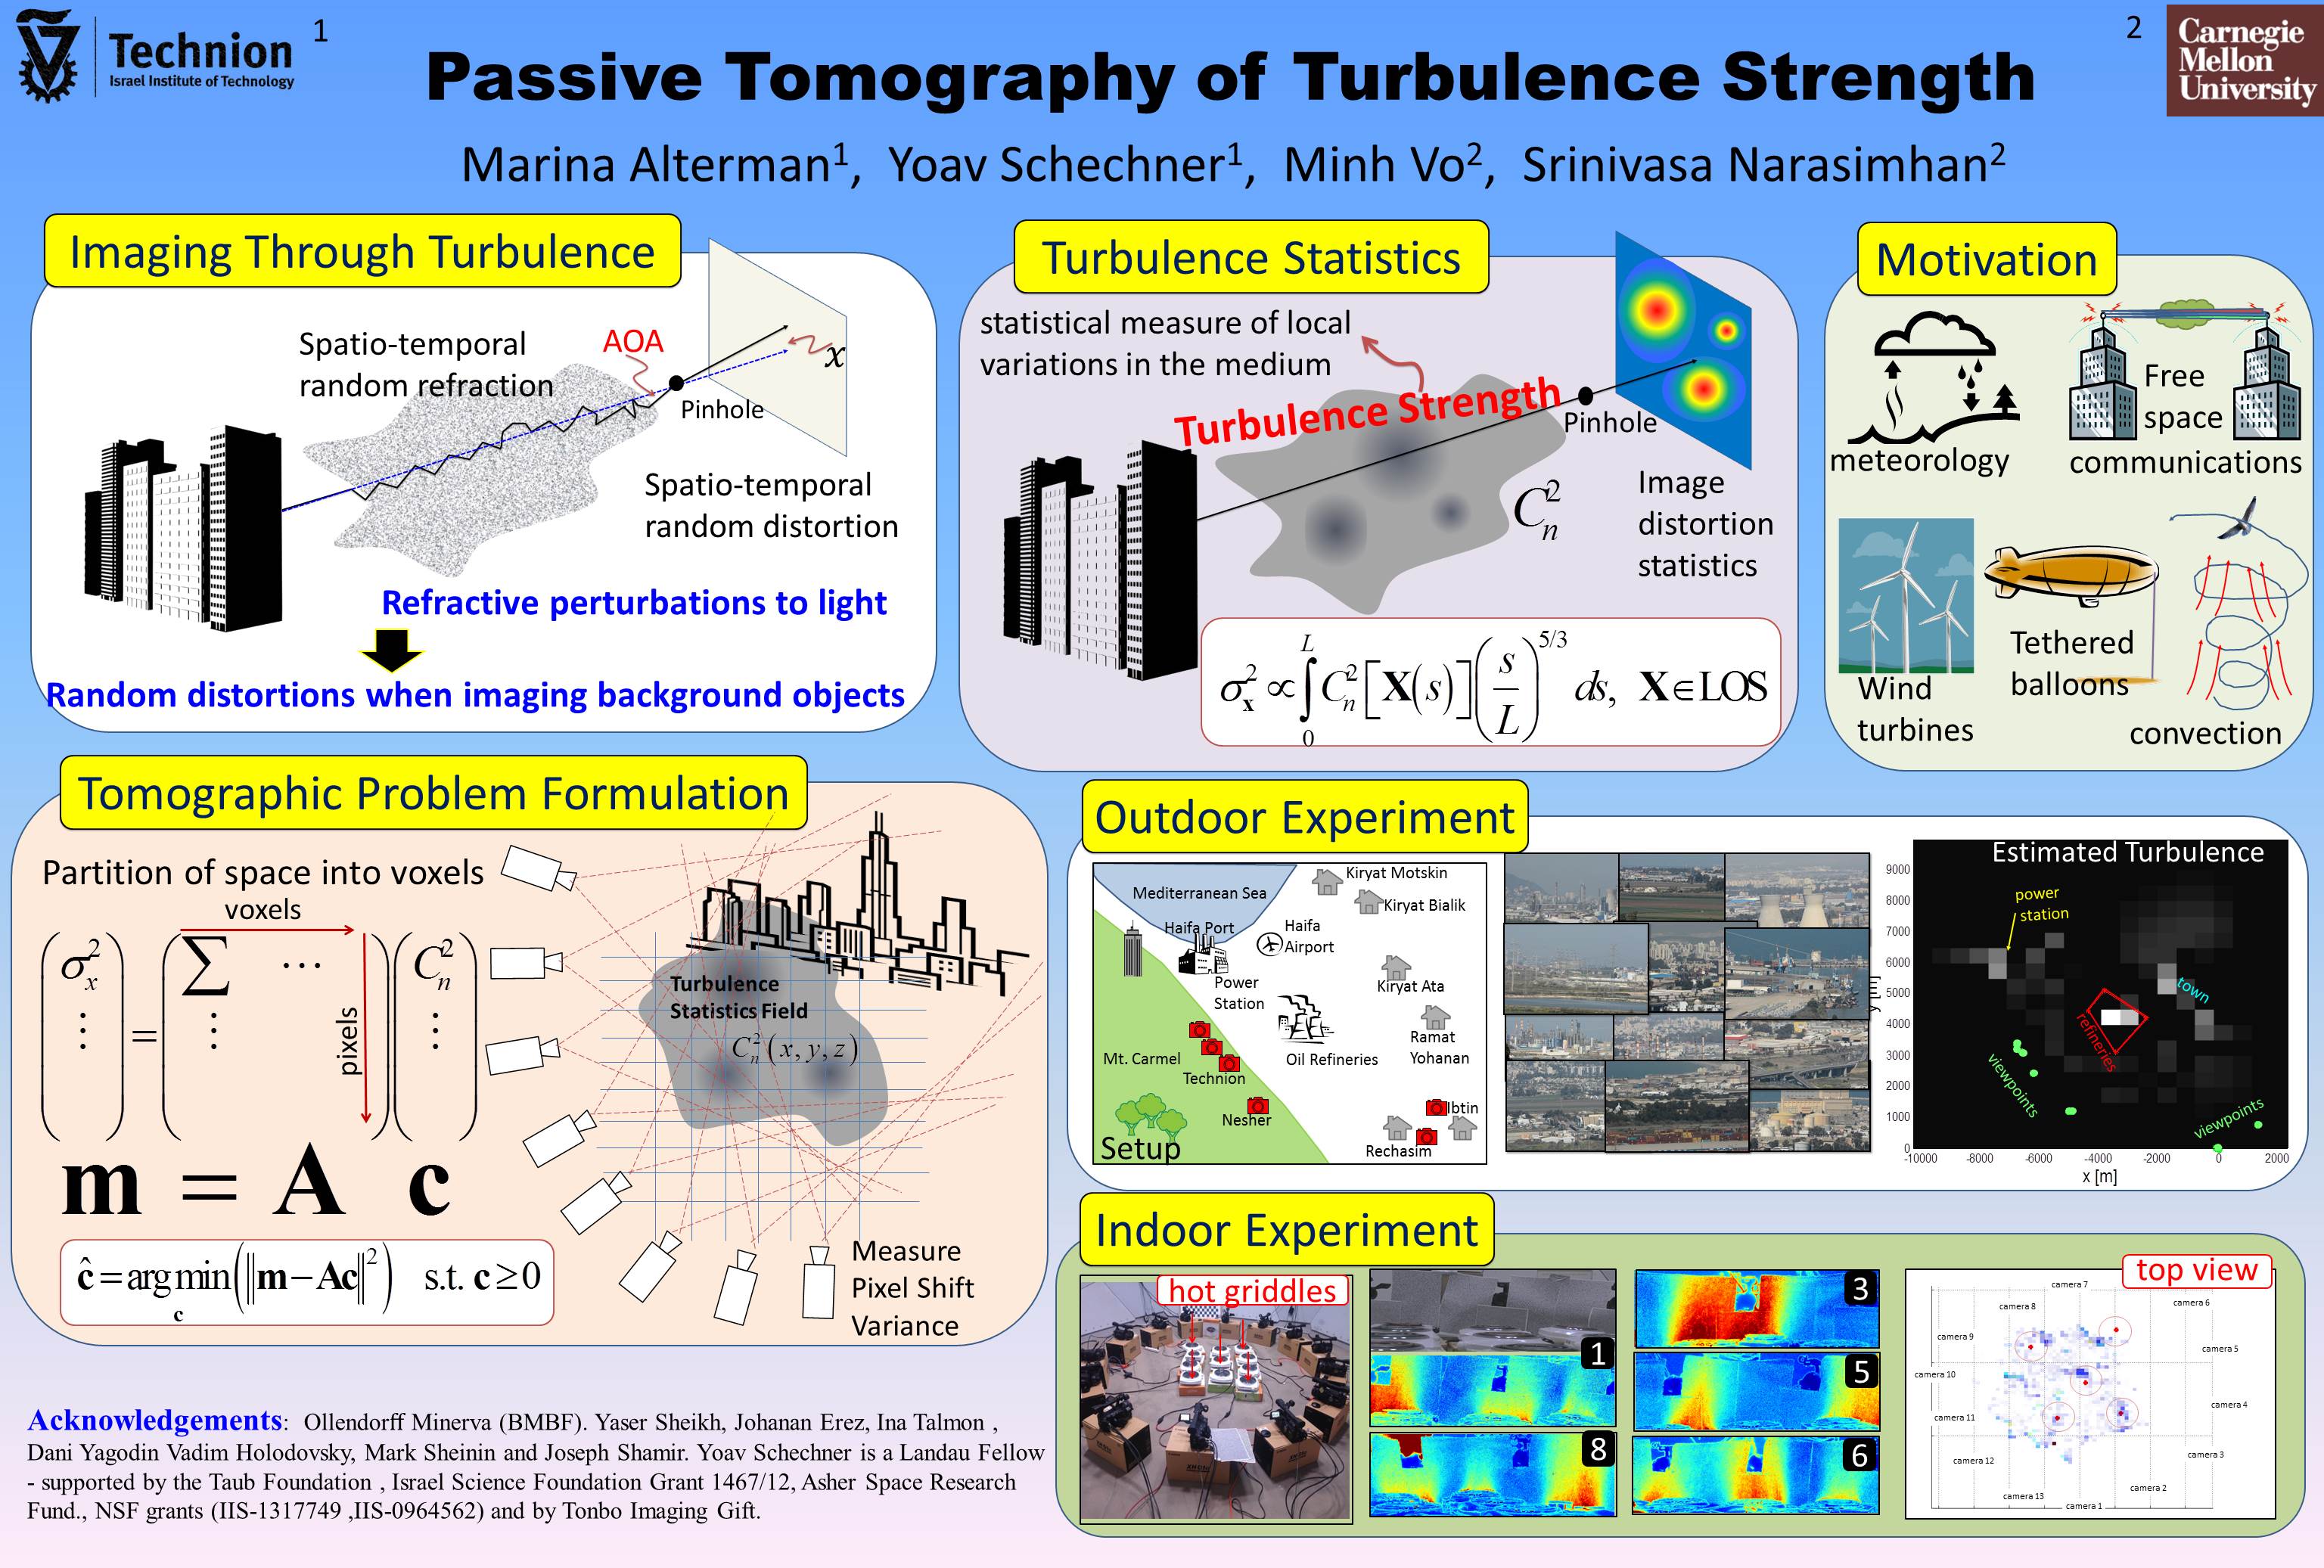
Turbulence is studied extensively in remote sensing, astronomy, meteorology, aerodynamics and fluid dynamics. The strength of turbulence is a statistical measure of local variations in the turbulent medium. It influences engineering decisions made in these domains. Turbulence strength (TS) also affects safety of aircraft and tethered balloons, and reliability of free-space electromagnetic relays. We show that it is possible to estimate TS, without having to reconstruct instantaneous fluid flow fields. Instead, the TS field can be directly recovered, passively, using videos captured from different viewpoints. We formulate this as a linear tomography problem with a structure unique to turbulence fields. No tight synchronization between cameras is needed. Thus, realization is very simple to deploy using consumer-grade cameras. We experimentally demonstrate this both in a lab and in a large-scale uncontrolled complex outdoor environment, which includes industrial, rural and urban areas. |
Publications
"Passive Tomography of Turbulence Strength"
M. Alterman, Y. Y. Schechner, M. Vo, and S. G. Narasimhan,
European Conference on Computer Vision 2014
[Paper] [Poster][Spotlight]
|
Technical summary
| |
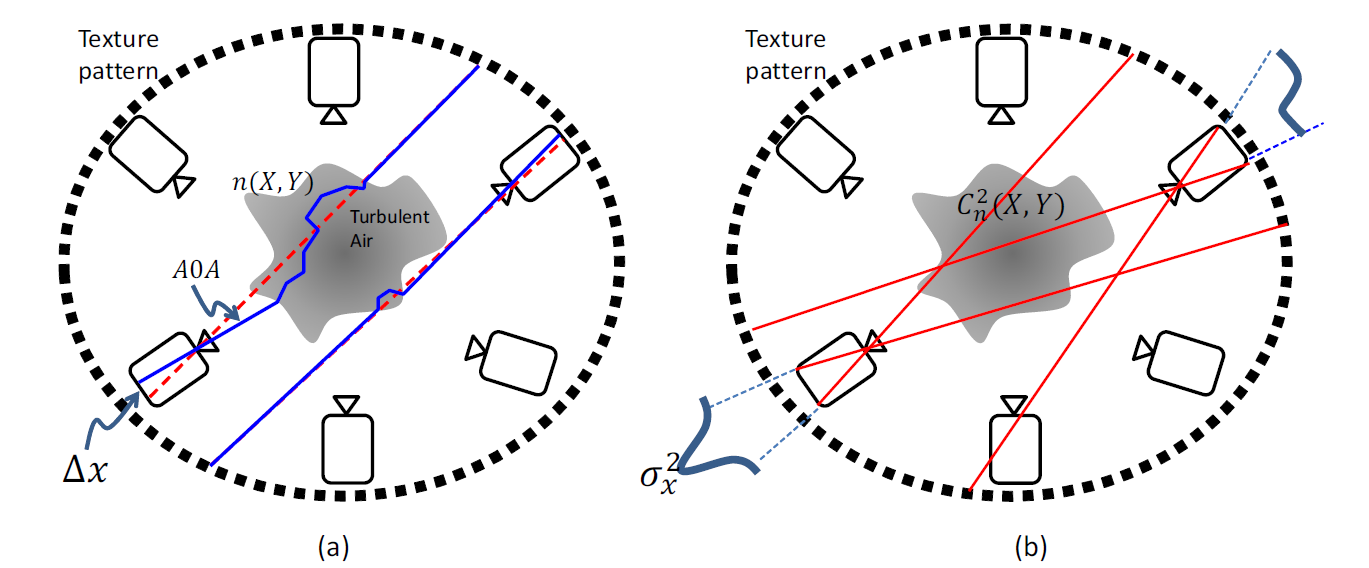
Principle for Passive Tomography of Turbulence Strength
Multiple cameras are placed around a chunk of turbulent air. (a) An object point of a textured pattern projects to a camera pixel through air having a spatially varying refractive index. (b) Temporal variance of pixel displacement of a textured object is associated to a pixel. This yields data for linear tomography of the statistical field C2n .
|
 |
Formulation of Passive Tomography of Turbulence Strength
The volume is discretized into voxels. Assuming the refractive index structure is constant within each voxel, its value can be estimated by solving a system of linear equations.
|
|
Results
 |
Laboratory experiment
Multiple cameras encircle hot electric cooking stoves which create turbulence. The heatmap of the sample variance images from different viewpoints are shown. The hotter the color is, the more turbulence strength is. In the top view of an estimated refractive index, the red dots indicate the true locations of hot operating stoves. Camera locations are also shown.
|
 |
Outdoor experiment
Outdoor experiement at the city of Hafia. It has a valley, surrounded by higher terrain, includes coastal suburbs, agricultural zones and heavy industry. Red cameras mark locations from which we took image sequences.
The estimated turbulence strength refractive index parameter shown in a 2D map. The bright areas represent the high values while dark areas represent low values. Regional places of interest are overlayed on the map. Notice the hottest spot is at the oil refineries.
|
|
Acknowledgements
This research was conducted in the Ollendorff Minerva Center. Minerva is funded through the BMBF. We thank Yaser Sheikh for allowing the use of the CMU Panoptic Studio. We are grateful to Joseph Shamir for useful discussions; Johanan Erez, Ina Talmon and Dani Yagodin for technical support; and Vadim Holodovsky and Mark Sheinin for helping with the experiments. We thank the anonymous reviewers for their useful comments. Yoav Schechner is a Landau Fellow - supported by the Taub Foundation. The work in the Technion group is supported by the Israel Science Foundation (ISF Grant 1467/12), and the Asher Space Research Fund. The work in the CMU group is supported by NSF grants (IIS-1317749 ,IIS-0964562) and by Tonbo Imaging Gift. |