15110 Fall 2012 [Touretzky/Kaynar]
Programming Assignment 11 - due Tuesday, November 13
Note: You are responsible for protecting your solutions to these
problems from being seen by other students either physically (e.g., by
looking over your shoulder) or electronically.
(More information can be found in the instructions
for Programming Assignment 2.)
Setup: We will be using the same Canvas module as in Lab 9.
This module is provided by RubyLabs. You will also need the file
pa11.rb that contains some utility functions.
- (1 pt) Write a method tester(width,height) in the file
tester.rb that creates a canvas with the specified
dimensions and draws a rectangle covering the entire canvas. The
rectangle should be filled with a random color. The method
random_color from the pa11.rb file will return a random color
name that can be used with the :fill keyword when you make
the rectangle.

- (1 pt) Write method divide_vertically(xmin,ymin,xmax,ymax)
that takes the coordinates of
the bottom left and top right corners of a rectangle as input. This
method will divide the rectangle into two pieces by selecting a random
percentage p of the width, between 20% and 80%, for the first
rectangle. The remainder of the width will be allocated to the second
rectangle. Use the following algorithm to calculate the coordinates
of these rectangles:
- Set xrange to (xmax-xmin).
- Set p to 0.2 + rand*0.6
- Set xmid to xmin + p*xrange
- Draw the two rectanges, each with a random color:
- Draw the left rectangle from (xmin,ymin) to (xmid,ymax).
- Draw the right rectangle from (xmid+1,ymin) to (xmax,ymax).
Modify the tester(width,height) method you wrote
previously. Instead of creating a rectangle, it should call
divide_vertically, passing it the coordinates of the top left
and bottom right corners of the canvas. Writing
tester(300,400) should prodce a result like the one shown
at right.
- (1 pt) Write a divide_horizontally(xmin,ymin,xmax,ymax)
method that works similarly to divide_vertically, but splits
the rectangle along the y-axis instead of the x-axis.
You can test your method by modifying tester again.

- (2 pts) Copy the file divide_vertically.rb to a new file
recurse_vertically.rb. Edit this file, changing the function
name to recurse_vertically. After the function draws each
sub-rectangle, it should divide it horizontally by calling
divide_horizontally on the rectangle's coordinates. (Notice
that there isn't any actual recursion going on yet, since no function
is calling itself. We'll fix that soon.)
Create a file mondrian.rb containing a method
mondrian(width,height) that is similar to tester
except it should call recurse_vertically instead of
divide_vertically. When you evaluate
mondrian(300,400) you should end up with four rectangles, as
shown in the figure at right, because recurse_vertically
calls divide_horizontally.
If you're unfamiliar with the Dutch artist Piet Mondrian, click here.
- (2 pts) Now copy the file divide_horizontally.rb to a
new file recurse_horizontally.rb, and edit that file. Rename
the function to recurse_horizontally and modify it so that it
calls recurse_vertically on the two sub-rectangles. Now the
computation is truly recursive and there is the potential for an
infinite loop. To prevent that, your function should immediately
return whenever yrange is less than 100.
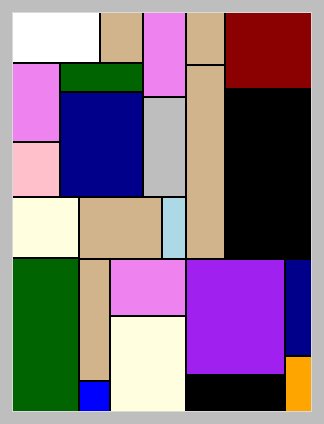
(corrected) Make the same modification to your
recurse_vertically function, so that it returns immediately
when xrange is less than 100. Also, change it to call
recurse_horizontally instead of divide_horizontally.
Now the result of calling mondrian(300,400) should look like
the figure shown at right.
Note how easily we produced this complex pattern with just a few
recursive calls. It is possible to produce the same result using a
while loop, but only by simulating the recursion stack ourselves using
a list, because the Mondrian decomposition is fundamentally recursive.
- (2 pts) The graph below is an example of an unweighted directed graph.
It can be represented using a connection matrix whose elements are
true and false. The function dag1 in pa11.rb
returns the connection matrix for this graph.
 This graph has a special property: it is acyclic, meaning
it contains no loops, including no self-links. The term DAG stands
for directed acyclic graph. Because the graph is acyclic, we can
write a recursive function to search for paths in the graph without
having to worry about getting caught in an infinite loop.
In the file has_path.rb, write a function
has_path?(graph,from,to) that returns true if there is
a path in the graph from node from to node to.
Examples:
This graph has a special property: it is acyclic, meaning
it contains no loops, including no self-links. The term DAG stands
for directed acyclic graph. Because the graph is acyclic, we can
write a recursive function to search for paths in the graph without
having to worry about getting caught in an infinite loop.
In the file has_path.rb, write a function
has_path?(graph,from,to) that returns true if there is
a path in the graph from node from to node to.
Examples:
>> has_path?(dag1, 0, 8)
=> true

>> has_path?(dag1, 1, 6)
=> false
Use the following algorithm for has_path?:
- If from equals to return true.
- Set row equal to the row of the graph given by from.
- For each position i from 0 to row.length-1 do:
- If row[i] is true, then...
- If has_path?(graph,i,to) is true, then ...
- Return true.
- If we reach this step, no value of i led to a path, so return false.
- (1 pt) We can display the path our algorithm found by adding
print statements before the return statements. If a path has been
found, we should print the from node. Because of the
recursive calls, this will end up printing the entire path, in reverse
order. Example:
>> show_path(dag1, 1, 9)
9 7 3 1 => true

>> show_path(dag1, 4, 9)
=> false
Copy the file has_path.rb to a new file show_path.rb
and edit the file. Your show_path method should print the
path as shown above, as well as returning true or false.
Submission
You should have a pa11 directory, containing:
tester.rb
divide_vertically.rb
divide_horizontally.rb
mondrian.rb
recurse_vertically.rb
recurse_horizontally.rb
has_path.rb
show_path.rb
Zip up your directory and upload it using the autolab system. (The autolab system
will accept submissions beginning on Friday until the deadline
Tuesday night.)