Gantt Chart

Gantt Chart Key
Row 1

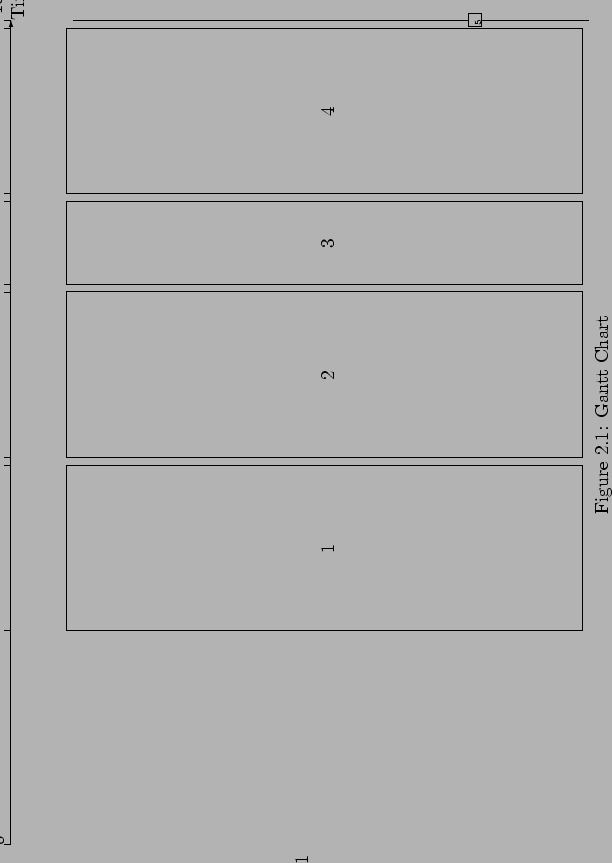
No         Time         Action 

1 2.6
(prepareobs1) [2]

2 4.7
(observe1) [2]

3 6.8
(prepareobs2) [1]

4 7.9
(observe2) [2]

5 10
(Timed Initial Literal Action 1)

\begin{figure}\begin{center}
\setlength{\unitlength}{80pt}
\begin{picture}(4.5,...
...\put(4.6,2.6){\rotcaption{Gantt Chart}}
\end{picture}
\end{center} \end{figure}


Derek Long 2006-10-09