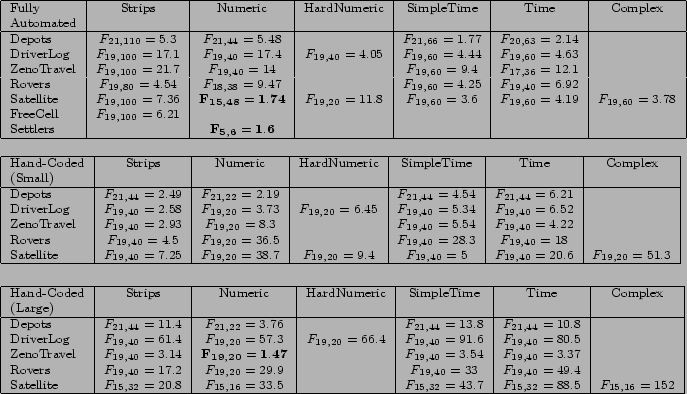
The cells in Figure 26 report the F values obtained (and the degrees of freedom used). In almost all cases the critical value was exceeded and the null hypothesis of non-agreement could be rejected for at least the 0.05 level. In just a few cases (those reported in bold font) the critical value was not exceeded and no statistical evidence was therefore found of agreement between the planners about the difficulty of instances in the corresponding domain and level. It is interesting to note that the problematic cases are all within the NUMERIC level, for both fully-automated and hand-coded planners. Furthermore, the case that comes closest to the critical boundary (the small Depots NUMERIC problems, in the hand coded table, with an F-value of 2.19) is also within the NUMERIC level.