About barcodes
Since edge detection in images is reliable, it makes sense to
encode information in the edge locations. The simplest way to do
so is a barcode, a sequence of alternating dark and light bars like the
following:
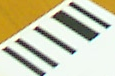
In the most common barcodes, the colors of the bars encode no
information (since they have to alternate in order to be visible);
instead each bar is one of several different widths. In the above
example, there are two widths, narrow and wide. The first and
last bars are always narrow and dark to help distinguish the start and
end of the code from surrounding features. The whole bar code
consists of these two sentinel bars with seven coding bars (four light
and three dark) between them. Of the seven coding bars exactly
three are wide, so that the code has constant length; so, this barcode
encodes one of choose(7,3)=35 different symbols.
One of the most common commercial barcodes (the one used in UPC
symbols) has four distinct bar widths and encodes the digits as follows:
0 = 3-2-1-1
1 = 2-2-2-1
2 = 2-1-2-2
3 = 1-4-1-1
4 = 1-1-3-2
5 = 1-2-3-1
6 = 1-1-1-4
7 = 1-3-1-2
8 = 1-2-1-3
9 = 3-1-1-2
It begins and ends the barcode with the sequence 1-1-1 (two narrow
black bars surrounding a narrow white bar).
Finding barcodes
[Under construction]
Reading barcodes
Once we have the location of a barcode, as indicted by the black and
yellow line in the following image:

we can read off the positions of the edges within the code:

The top graph is the intensity of the barcode, proceeding from upper
left to lower right. The bottom graph is the response of an edge
filter along the same path. (We used (g'd)^2, where g is the
image gradient and d is a vector pointing along the barcode.) The
horizontal line in the bottom graph is a cutoff, which is adjusted to
make sure that we detect exactly 10 edges (the correct number of edges
for this bar code). An edge is defined to be a sufficiently large
local maximum of the bottom graph, that is,
edge(i) > edge(i-1) && edge(i) >
edge(i+1) && edge(i) > cutoff
We can take the difference between the locations of the first and last
edges and divide by 12 to estimate the width of a narrow bar in this
image; a wide bar should be exactly twice as wide as a narrow
one. Once we know this width, we can check each gap between edges
and call it narrow if and only if the gap is less than 1.5 times the
estimated width of a narrow bar. Doing so on the above barcode
yields the following (correct) reading:
(N) N N W N W N W (N)
The beginning and ending narrow bars are listed in parentheses, since
they aren't coding bars.
Because edge detection is reliable, we can often read the barcodes even
if we don't know their locations exactly:

When processing the above image, the edge strength cutoff eliminates
the weak edge between the sheet of paper and the table and leaves only
the barcode edges:

(The above graphs proceed from lower left to upper right in the
image.) With the extraneous edge eliminated, we get a correct
reading:
(N) N N W W N W N (N)